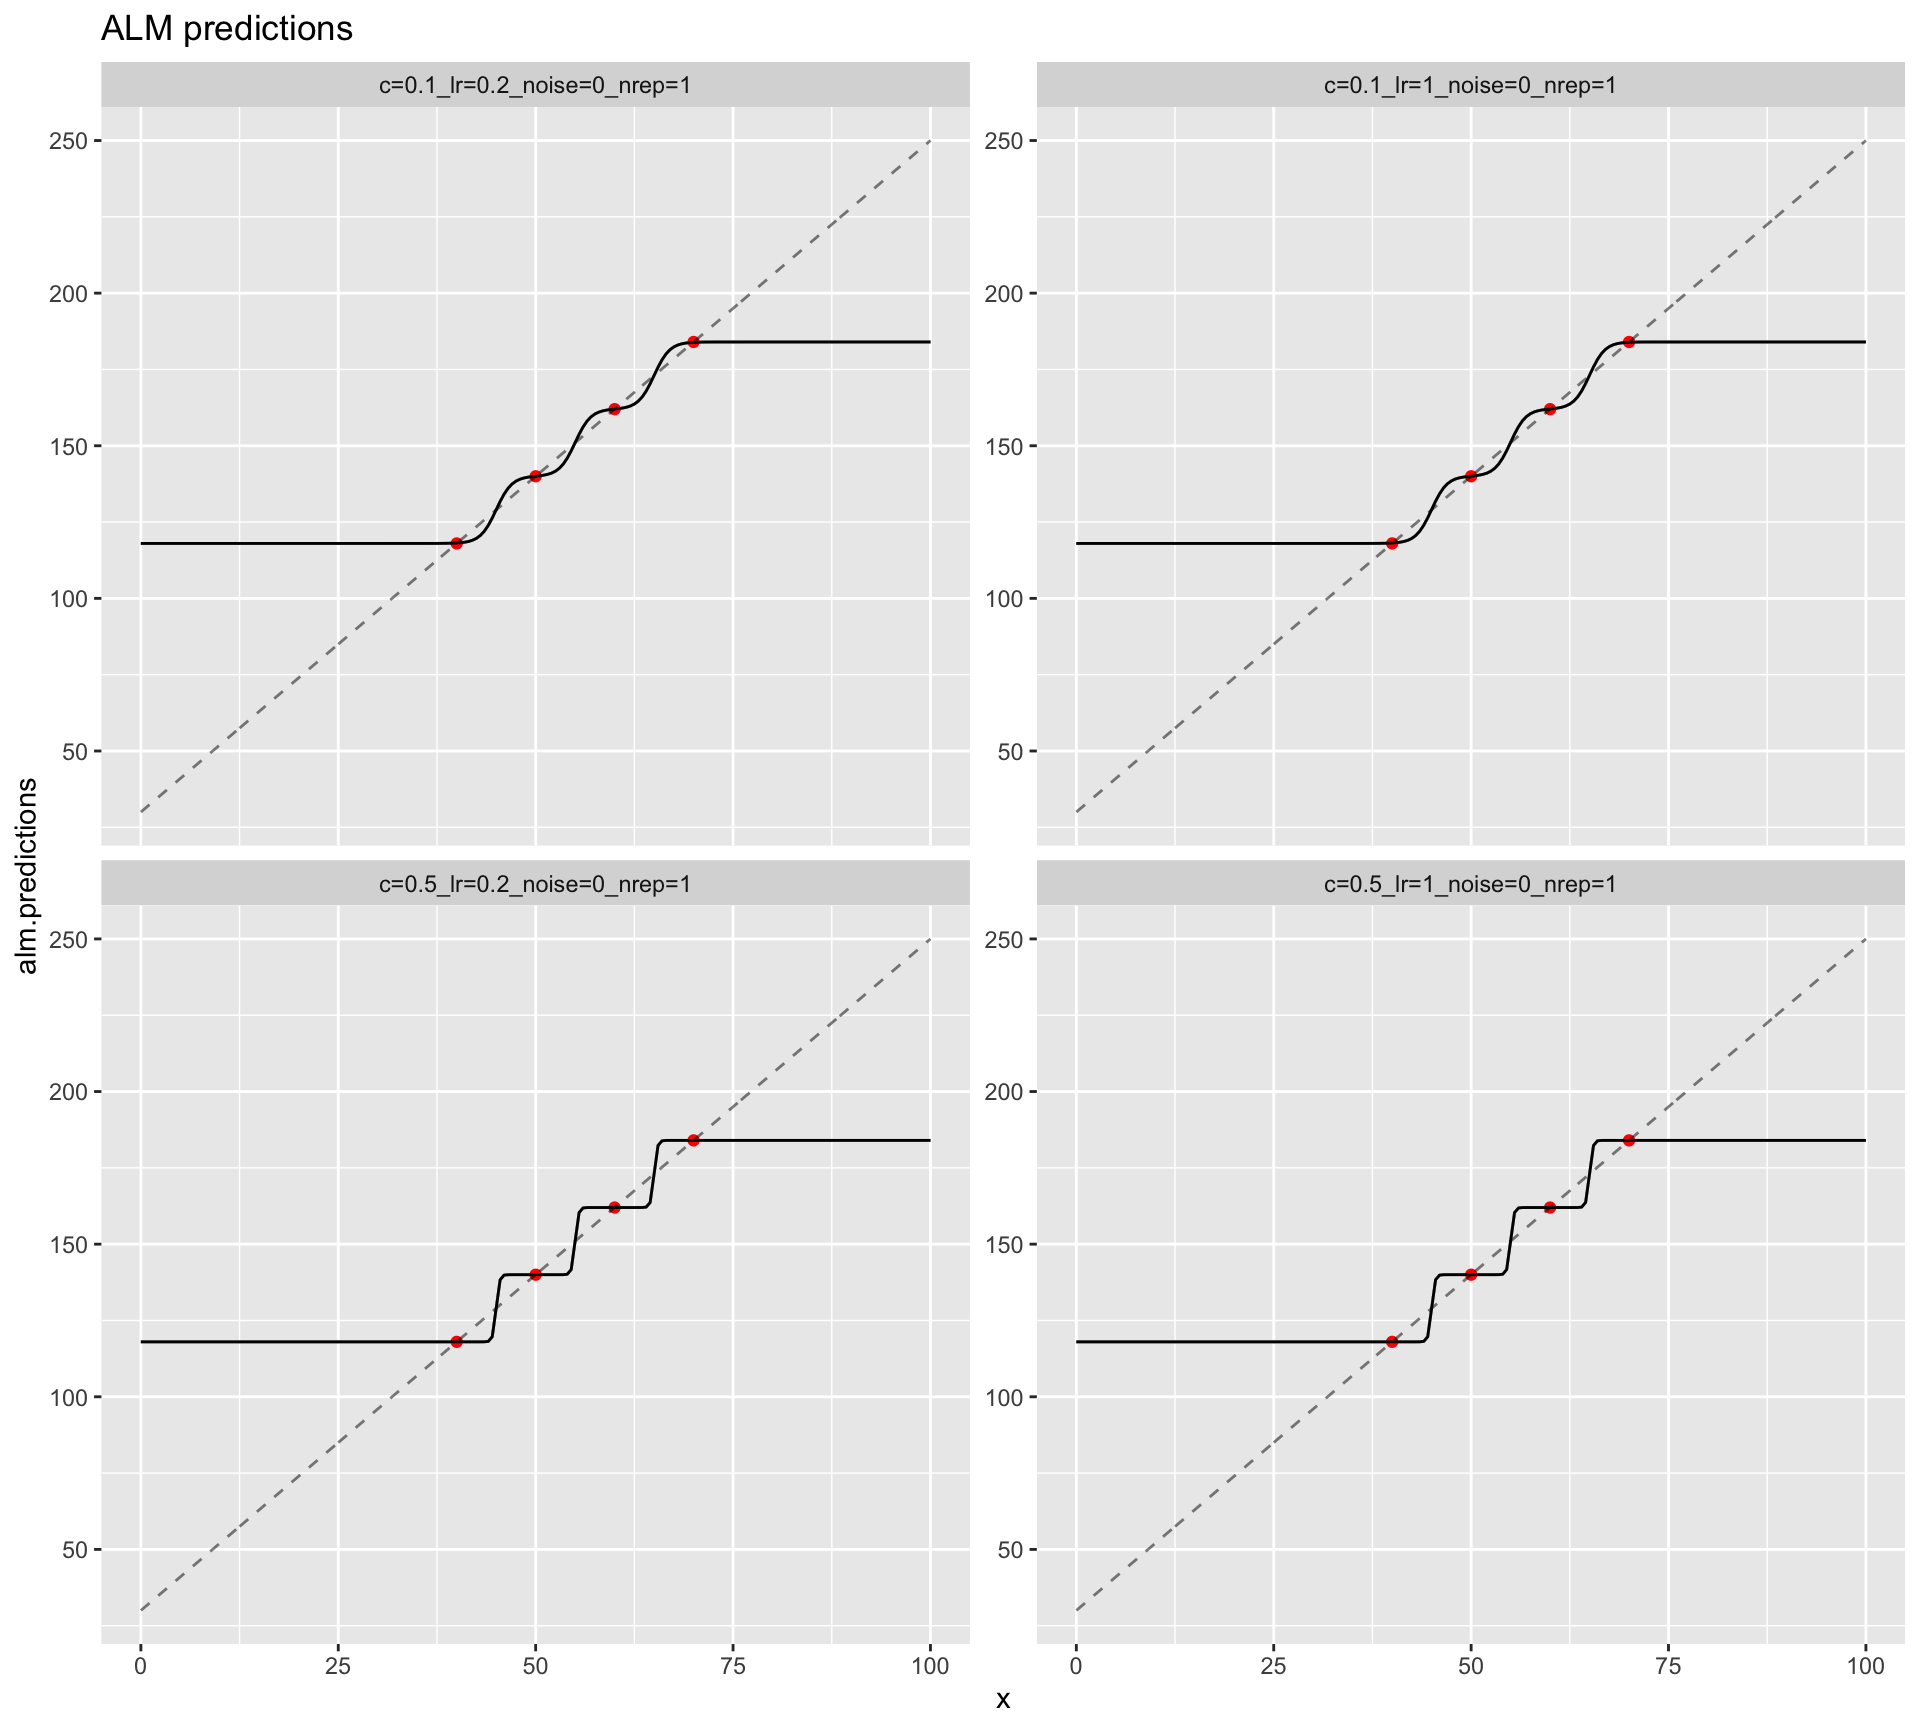
Red dots are training points - gray lines are individual simulations, black line is average of simulations
Code
# | eval: falsetrainRep=1x.plotting<<-seq(0,100, .5)y.plotting<<-seq(0, 210, by=2)f.plotting<-as.numeric(x.plotting*2.2+30)x.learning<-rep(x.plotting[20*c(4:7)+1])f.learning<-rep(f.plotting[20*c(4:7)+1])parmVec<-expand.grid(assoc=c(.1,0.5),update=c(0.2,1),noise=c(0),trainRep=c(1))#parmVec <- expand.grid(assoc=c(.01),update=c(0.5),noise=c(30),trainRep=c(1,2,3,4))parmVec$sim<-1:nrow(parmVec)nSim=nrow(parmVec)nRep=5output<-list()for(iin1:nrow(parmVec)){x.learning<-rep(x.plotting[20*c(4:7)+1],times=parmVec$trainRep[i])f.learning<-rep(f.plotting[20*c(4:7)+1],times=parmVec$trainRep[i])#noise.learning <- rnorm(n_distinct(f.learning),sd=parmVec$noise[i])output[[i]]<-replicate(nRep, list(learn.alm(f.learning+rep(rnorm(n_distinct(f.learning),sd=parmVec$noise[i]),times=parmVec$trainRep[i]), association.parameter=parmVec$assoc[i], update.parameter=parmVec$update[i])))}# convert list of dataframes to a list of lists, each list is a simulation, each element is a dataframeoutput1<-lapply(output, function(x)lapply(x, as.data.frame))# 10 dfs x 9 listsoutput2<-lapply(output1, function(x)Reduce(rbind,x))# 1 df x 9 listsoutput3<-lapply(output2, function(x)mutate(x, x=rep(x.plotting,nRep),y=rep(f.plotting,nRep), repN=rep(seq(1,nRep),each=length(x.plotting))))o4<-Reduce(rbind,output3)%>%mutate(sim=rep(seq(1,nrow(parmVec)),each=nRep*length(x.plotting)))%>%left_join(.,parmVec,by="sim")%>%mutate(pvec=paste0("c=",assoc,"_lr=",update,"_noise=",noise,"_nrep=",trainRep),pv=factor(pvec),rn=factor(repN))oMeans<-o4%>%group_by(pv,x,y)%>%summarise(alm.predictions=mean(alm.predictions),exam.predictions=mean(exam.predictions),.groups="keep")o4%>%ggplot(aes(x=x,y=alm.predictions,color=rn))+geom_line(alpha=.7)+scale_color_manual(values=rep("grey",nRep))+theme(legend.position="none")+geom_point(data=data.frame(x=x.learning,y=f.learning),aes(x=x,y=y),color="red")+geom_line(data=o4,aes(x=x,y=y),color="black",alpha=.5, linetype=2)+geom_line(data=oMeans,aes(x=x,y=alm.predictions),color="black")+facet_wrap(~pv, scales="free_y")+ggtitle("ALM predictions")
Red dots are training points - gray lines are individual simulations, black line is average of simulations
Code
trainRep=1x.plotting<<-seq(0,100, .5)y.plotting<<-seq(0, 210, by=2)f.plotting<-as.numeric(x.plotting*2.2+30)x.learning<-rep(x.plotting[20*c(4:7)+1])f.learning<-rep(f.plotting[20*c(4:7)+1])parmVec<-expand.grid(assoc=c(.1,0.5),update=c(0.2,1),noise=c(30),trainRep=c(1))#parmVec <- expand.grid(assoc=c(.01),update=c(0.5),noise=c(30),trainRep=c(1,2,3,4))parmVec$sim<-1:nrow(parmVec)nSim=nrow(parmVec)nRep=10output<-list()for(iin1:nrow(parmVec)){x.learning<-rep(x.plotting[20*c(4:7)+1],times=parmVec$trainRep[i])f.learning<-rep(f.plotting[20*c(4:7)+1],times=parmVec$trainRep[i])#noise.learning <- rnorm(n_distinct(f.learning),sd=parmVec$noise[i])output[[i]]<-replicate(nRep, list(learn.alm(f.learning+rep(rnorm(n_distinct(f.learning),sd=parmVec$noise[i]),times=parmVec$trainRep[i]), association.parameter=parmVec$assoc[i], update.parameter=parmVec$update[i])))}# # nRep=3# output <- list()# for (i in 1:nrow(parmVec)){# output[[i]] <- replicate(nRep, list(learn.alm(f.learning + rnorm(length(f.learning), sd=10), # association.parameter=parmVec$assoc[i], update.parameter=parmVec$update[i])))# }#output[[i]] <- replicate(nRep, list(learn.alm(f.learning + rnorm(length(f.learning), sd=10)# convert list of dataframes to a list of lists, each list is a simulation, each element is a dataframeoutput1<-lapply(output, function(x)lapply(x, as.data.frame))# 10 dfs x 9 listsoutput2<-lapply(output1, function(x)Reduce(rbind,x))# 1 df x 9 listsoutput3<-lapply(output2, function(x)mutate(x, x=rep(x.plotting,nRep),y=rep(f.plotting,nRep), repN=rep(seq(1,nRep),each=length(x.plotting))))o4<-Reduce(rbind,output3)%>%mutate(sim=rep(seq(1,nrow(parmVec)),each=nRep*length(x.plotting)))%>%left_join(.,parmVec,by="sim")%>%mutate(pvec=paste0("c=",assoc,"_lr=",update,"_noise=",noise,"_nrep=",trainRep),pv=factor(pvec),rn=factor(repN))oMeans<-o4%>%group_by(pv,x,y)%>%summarise(alm.predictions=mean(alm.predictions),exam.predictions=mean(exam.predictions),.groups="keep")o4%>%ggplot(aes(x=x,y=alm.predictions,color=rn))+geom_line(alpha=.7)+scale_color_manual(values=rep("grey",nRep))+theme(legend.position="none")+geom_point(data=data.frame(x=x.learning,y=f.learning),aes(x=x,y=y),color="red")+geom_line(data=o4,aes(x=x,y=y),color="black",alpha=.5, linetype=2)+geom_line(data=oMeans,aes(x=x,y=alm.predictions),color="black")+facet_wrap(~pv, scales="free_y")+ggtitle("ALM predictions")+ylim(0,300)o4%>%ggplot(aes(x=x,y=exam.predictions,color=rn))+geom_line()+#geom_line(color="grey",alpha=.4)+scale_color_manual(values=rep("grey",nRep))+theme(legend.position="none")+geom_point(data=data.frame(x=x.learning,y=f.learning),aes(x=x,y=y),color="red")+geom_line(data=o4,aes(x=x,y=y),color="black",alpha=.5,linetype=2)+geom_line(data=oMeans,aes(x=x,y=exam.predictions),color="black")+facet_wrap(~pv, scales="free_y")+ggtitle("EXAM predictions")+ylim(0,300)
High noise, 60 training rep
Red dots are training points - gray lines are individual simulations, black line is average of simulations
Code
trainRep=1x.plotting<<-seq(0,100, .5)y.plotting<<-seq(0, 210, by=2)f.plotting<-as.numeric(x.plotting*2.2+30)x.learning<-rep(x.plotting[20*c(4:7)+1])f.learning<-rep(f.plotting[20*c(4:7)+1])parmVec<-expand.grid(assoc=c(.1,0.5),update=c(0.2,1),noise=c(30),trainRep=c(60))#parmVec <- expand.grid(assoc=c(.01),update=c(0.5),noise=c(30),trainRep=c(1,2,3,4))parmVec$sim<-1:nrow(parmVec)nSim=nrow(parmVec)nRep=10output<-list()for(iin1:nrow(parmVec)){x.learning<-rep(x.plotting[20*c(4:7)+1],times=parmVec$trainRep[i])f.learning<-rep(f.plotting[20*c(4:7)+1],times=parmVec$trainRep[i])#noise.learning <- rnorm(n_distinct(f.learning),sd=parmVec$noise[i])output[[i]]<-replicate(nRep, list(learn.alm(f.learning+rep(rnorm(n_distinct(f.learning),sd=parmVec$noise[i]),times=parmVec$trainRep[i]), association.parameter=parmVec$assoc[i], update.parameter=parmVec$update[i])))}# convert list of dataframes to a list of lists, each list is a simulation, each element is a dataframeoutput1<-lapply(output, function(x)lapply(x, as.data.frame))# 10 dfs x 9 listsoutput2<-lapply(output1, function(x)Reduce(rbind,x))# 1 df x 9 listsoutput3<-lapply(output2, function(x)mutate(x, x=rep(x.plotting,nRep),y=rep(f.plotting,nRep), repN=rep(seq(1,nRep),each=length(x.plotting))))o4<-Reduce(rbind,output3)%>%mutate(sim=rep(seq(1,nrow(parmVec)),each=nRep*length(x.plotting)))%>%left_join(.,parmVec,by="sim")%>%mutate(pvec=paste0("c=",assoc,"_lr=",update,"_noise=",noise,"_nrep=",trainRep),pv=factor(pvec),rn=factor(repN))oMeans<-o4%>%group_by(pv,x,y)%>%summarise(alm.predictions=mean(alm.predictions),exam.predictions=mean(exam.predictions),.groups="keep")o4%>%ggplot(aes(x=x,y=alm.predictions,color=rn))+geom_line(alpha=.7)+scale_color_manual(values=rep("grey",nRep))+theme(legend.position="none")+geom_point(data=data.frame(x=x.learning,y=f.learning),aes(x=x,y=y),color="red")+geom_line(data=o4,aes(x=x,y=y),color="black",alpha=.5, linetype=2)+geom_line(data=oMeans,aes(x=x,y=alm.predictions),color="black")+facet_wrap(~pv, scales="free_y")+ggtitle("ALM predictions")+ylim(0,300)o4%>%ggplot(aes(x=x,y=exam.predictions,color=rn))+geom_line()+#geom_line(color="grey",alpha=.4)+scale_color_manual(values=rep("grey",nRep))+theme(legend.position="none")+geom_point(data=data.frame(x=x.learning,y=f.learning),aes(x=x,y=y),color="red")+geom_line(data=o4,aes(x=x,y=y),color="black",alpha=.5,linetype=2)+geom_line(data=oMeans,aes(x=x,y=exam.predictions),color="black")+facet_wrap(~pv, scales="free_y")+ggtitle("EXAM predictions")+ylim(0,300)