Methods
Methods
Participants A total of 156 participants were recruited from the Indiana University Introductory Psychology Course. Participants were randomly assigned to one of two training conditions: varied training or constant training.
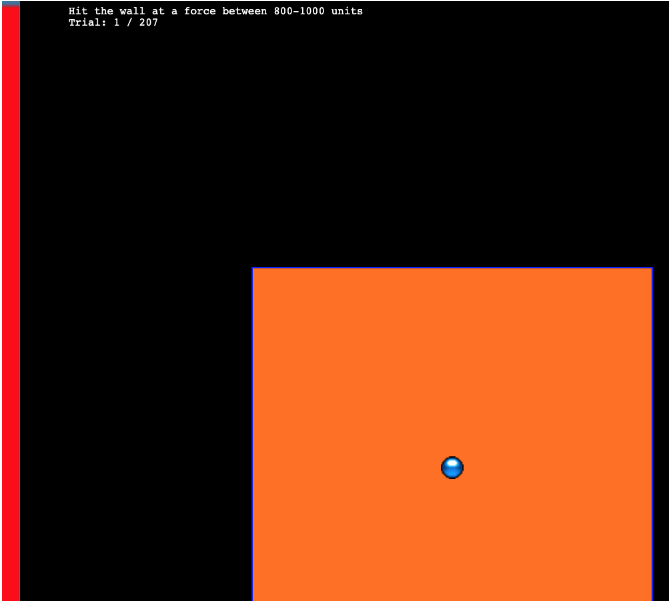
Task. The “Hit The Wall” (HTW) visuomotor extrapolation task task was programmed in Javascript, making heavy use of the phaser.io game library. The HTW task involved launching a projectile such that it would strike the “wall” at target speed indicated at the top of the screen (see Figure 1). The target velocities were given as a range, or band, of acceptable velocity values (e.g. band 800-1000). During the training stage, participants received feedback indicating whether they had hit the wall within the target velocity band, or how many units their throw was above or below from the target band. Participants were instructed that only the x velocity component of the ball was relevant to the task. The y velocity, or the location at which the ball struck the wall, had no influence on the task feedback.
Procedure
Procedure. All participants completed the task online. Participants were provided with a description of the experiment and indicated informed consent. Figure 2 illustrates the general procedure. Participants completed a total of 90 trials during the training stage. In the varied training condition, participants encountered three velocity bands (800-1000, 1000-1200, and 1200-1400). Participants in the constant training condition trained on only one velocity band (800-1000) - the closest band to what would be the novel extrapolation bands in the testing stage.
Following the training stage, participants proceeded immediately to the testing stage. Participants were tested from all six velocity bands, in two separate stages. In the novel extrapolation testing stage, participants completed “no-feedback” testing from three novel extrapolation bands (100-300, 350-550, and 600-800), with each band consisting of 15 trials. Participants were also tested from the three velocity bands that were trained by the varied condition (800-1000, 1000-1200, and 1200-1400). In the constant training condition, two of these bands were novel, while in the varied training condition, all three bands were encountered during training. The order in which participants completed the novel-extrapolation and testing-from-3-varied bands was counterbalanced across participants. A final training stage presented participants with “feedback” testing for each of the three extrapolation bands (100-300, 350-550, and 600-800).
Code
/////| column: screen-inset-right
digraph {
  graph [layout = dot, rankdir = LR]

  // define the global styles of the nodes
  node [shape = rectangle, style = filled]

  data1 [label = " Varied Training \n800-1000\n1000-1200\n1200-1400", fillcolor = "#FF0000"]
  data2 [label = " Constant Training \n800-1000", fillcolor = "#00A08A"]
  Test3 [label = "    Final Test \n  Novel With Feedback  \n100-300\n350-550\n600-800", fillcolor = "#ECCBAE"]

  // edge definitions with the node IDs
  data1 -> Test1
  data2 -> Test1

  subgraph cluster {
    label = "Test Phase \n(Counterbalanced Order)"
    Test1 [label = "Test  \nNovel Bands \n100-300\n350-550\n600-800", fillcolor = "#ECCBAE"]
    Test2 [label = "  Test \n  Varied Training Bands  \n800-1000\n1000-1200\n1200-1400", fillcolor = "#ECCBAE"]
    Test1 -> Test2
  }

  Test2 -> Test3
}