---
title: Dot Pattern Similarity Rating Analysis
date: last-modified
lightbox: true
aliases:
- /dotSim_compare.html
toc: true
page-layout: full
format:
html:
grid:
sidebar-width: 200px
body-width: 1250px
margin-width: 140px
gutter-width: 1.0rem
toc-depth: 3
code-fold: true
code-tools: true
execute:
warning: false
eval: true
---
```{r}
pacman::p_load(dplyr,purrr,tidyr,ggplot2, here, patchwork,
  conflicted, jsonlite,stringr, gt, knitr, kableExtra,
  lubridate,ggh4x, lmerTest)
walk(c("dplyr", "lmerTest"), conflict_prefer_all, quiet = TRUE)
options(digits=2, scipen=999, dplyr.summarise.inform=FALSE)
walk(c("fun_plot"), ~ source(here::here(paste0("R/", .x, ".R"))))
mc24_proto <- read.csv(here("Stimulii","mc24_prototypes.csv")) |> mutate(set=paste0(sbjCode,"_",condit))
sbj_cat <- read.csv(here("data","mc24_sbj_cat.csv")) |> mutate(condit=factor(condit,levels=c("low","medium","mixed","high") ))


theme_set(theme_nice_b())

dfiles <- list(path=list.files(here::here("data/dotSim_data"),full.names=TRUE))

d <- map_dfr(dfiles$path, ~read.csv(.x))

d <- map_dfr(dfiles$path, ~{read.csv(.x) |>
    mutate(sfile=tools::file_path_sans_ext(basename(.x)))}) |>
  select(-trial_index, -internal_node_id,-trial_type) |>
   mutate(set = paste(str_extract(item_label_1, "^\\d+"),
                     str_extract(item_label_1, "[a-z]+"), sep = "_")) |>
  mutate(pair_label = paste0(item_label_1,"_",item_label_2)) |>
  relocate(sbjCode,date,set,pair_label,trial,item_label_1,item_label_2,response,rt)

setCounts <- d |>
  pivot_longer(cols=c(item_label_1, item_label_2), names_to="item_label", values_to="item") |>
  group_by(set) |> summarise(n=n_distinct(sbjCode),resp=mean(response),sd=sd(response)) |> arrange(desc(n))

# length(unique(mc_proto$set)) # 304
setCounts2 <- mc24_proto |> group_by(set) |>
  slice_head(n=1) |>
  select(id,file,set) |>
  left_join(setCounts,by="set") |>
  mutate(n = ifelse(is.na(n), 0, n), .groups="drop") |>
  arrange(n) |> ungroup()


gpt_rate <- readRDS(here("llm/first_full_run.rds")) |> select(pair_label,set,gpt4o_rating)

d <- d |> left_join(gpt_rate,by=c("set","pair_label"))


### By Pair Max/Min
pairCounts <- d |>
  pivot_longer(cols=c(item_label_1, item_label_2), names_to="item_label", values_to="item") |>
  group_by(set,item, file,pair_label) |>
  summarise(n_rating=n(),mean_resp=mean(response)) |>
  group_by(item,file,set) |>
  summarise(n_rating=first(n_rating),max_sim=max(mean_resp), min_sim=min(mean_resp)) |>
  arrange(desc(n_rating),item) |> ungroup()

max_sim <- sbj_cat |>
  mutate(item=item_label) |>
  left_join(pairCounts,by=c("file","item")) |>
  mutate(sim_group = ifelse(max_sim>5.5,"Very Similar",ifelse(max_sim<3.9,"Very Dissimilar","Medium"))) |>
  mutate(sim_group=factor(sim_group,levels=c("Very Dissimilar","Medium","Very Similar")))

cat_sim_test2 <- max_sim |>
  filter(Phase==2) |>
  mutate(rate_quartile = as.factor(ntile(max_sim, 4))) |>
  group_by(id,condit) |>
  mutate(agg_corr=mean(Corr)) |>
  group_by(condit) |>
  mutate(quartile=ntile(agg_corr,4),ms=ntile(agg_corr,2))


### By Pattern Average
patternAvg <- d |>
  pivot_longer(cols=c(item_label_1, item_label_2), names_to="item_label", values_to="item") |>
  group_by(item,file) |>
  summarise(n_rating=n(),resp=mean(response),sd=sd(response),gpt_sim=mean(gpt4o_rating)) |>
  arrange(desc(n_rating))

cat_sim <- sbj_cat |>
  mutate(item=item_label) |>
  left_join(patternAvg,by=c("file","item"))  |> arrange(desc(n_rating)) |>
  #remove rows where n_rating is NA, or less than 4
  filter(!is.na(n_rating),n_rating>=12) |>
  mutate(sim_group = ifelse(resp>5.5,"Very Similar",ifelse(resp<3.9,"Very Dissimilar","Medium"))) |>
  mutate(sim_group=factor(sim_group,levels=c("Very Dissimilar","Medium","Very Similar")))

cat_sim_test <- cat_sim |>
  filter(Phase==2) |>
  mutate(rate_quartile = as.factor(ntile(resp, 4))) |>
  group_by(id,condit) |>
  mutate(agg_corr=mean(Corr)) |>
  group_by(condit) |>
  mutate(quartile=ntile(agg_corr,4),ms=ntile(agg_corr,2))
```
```{r}
#| fig-width: 11
#| fig-height: 9
# cat_sim_test |>
#   group_by(condit,quartile) |>
#   summarize(mean_resp=mean(resp),mean_corr=mean(Corr),n=n_distinct(file), .groups="drop")

# cat_sim_test |>
#   group_by(sbjCode,condit,quartile,rate_quartile) |>
#   summarize(resp=mean(resp),corr=mean(Corr)) |>
#   mutate(quartile=factor(quartile,levels=c(1,2,3,4))) |>
#   ggplot(aes(x=quartile,y=corr,fill=condit)) +
#   stat_bar+
#  # geom_boxplot() +
#   facet_wrap(~rate_quartile) +
#   labs(y="Similarity Rating",x="Performance Quartile")


cat_sim_test |>
  group_by(sbjCode,condit,quartile,rate_quartile) |>
  summarize(resp=mean(resp),corr=mean(Corr)) |>
  mutate(quartile=factor(quartile,levels=c(1,2,3,4))) |>
  ggplot(aes(x=condit,y=corr,fill=rate_quartile)) +
  stat_bar +
 # geom_boxplot() +
#   facet_wrap(~condit) +
  labs(y="CatLearn Accuracy",x="Training Condition")
cat_sim_test |>
  group_by(sbjCode,condit,ms,sim_group) |>
  summarize(resp=mean(resp),corr=mean(Corr)) |>
  mutate(ms=factor(ms,levels=c(1,2))) |>
  ggplot(aes(x=condit,y=corr,fill=sim_group)) +
  stat_bar +
  facet_wrap(~ms) +
  labs(y="CatLearn Accuracy",x="Training Condition")
```
### Using Maximum rather than mean similarity
```{r}
#| fig-width: 11
#| fig-height: 9
cat_sim_test2 |>
  group_by(sbjCode,condit,quartile,rate_quartile) |>
  summarize(resp=mean(max_sim),corr=mean(Corr)) |>
  mutate(quartile=factor(quartile,levels=c(1,2,3,4))) |>
  ggplot(aes(x=condit,y=corr,fill=rate_quartile)) +
  stat_bar +
 # geom_boxplot() +
#   facet_wrap(~condit) +
  labs(y="CatLearn Accuracy",x="Training Condition")
cat_sim_test2 |>
  group_by(sbjCode,condit,ms,sim_group) |>
  summarize(resp=mean(max_sim),corr=mean(Corr)) |>
  mutate(ms=factor(ms,levels=c(1,2))) |>
  ggplot(aes(x=condit,y=corr,fill=sim_group)) +
  stat_bar +
  facet_wrap(~ms) +
  labs(y="CatLearn Accuracy",x="Training Condition")
```
## Correlations with Accuracy in Hu & Nosofsky 2024
#### Assess # of patterns in various binnings - e.g. quartile, decile
```{r}
#| fig-width: 11
#| fig-height: 9
# bin data by rating (resp) into quartiles
t1 <- cat_sim |>
  mutate(Quartile = ntile(resp, 4))|>
  group_by(Quartile) |>
  summarize("Avg. Similarity Rating"=mean(resp),sd=sd(resp),n_ratings=n_distinct(file), .groups="drop")

t2 <- cat_sim |>
  mutate(Decile = ntile(resp, 10))|>
  group_by(Decile) |>
  summarize("Avg. Similarity Rating"=mean(resp),sd=sd(resp),n_ratings=n_distinct(file), .groups="drop")


t3 <- cat_sim |>
  group_by(sim_group) |>
  summarize("Avg. Similarity Rating"=mean(resp),sd=sd(resp),n_ratings=n_distinct(file), .groups="drop")

t1 |> kbl(caption="Quartiles")
t2 |> kbl(caption="Deciles")
t3 |> kbl(caption="Extreme Groups")
```
```{r}
#| fig-width: 12
#| fig-height: 11
#|
g1 <- cat_sim_test |>
  group_by(sbjCode,condit) |>
  summarize(resp=mean(resp)) |>
  ggplot(aes(x=condit,y=resp)) +
  #stat_bar +
  geom_boxplot() +
  labs(y="Similarity Rating",x="2024 - Training Condition")


g2 <- cat_sim_test |>
  group_by(sbjCode,condit,Category) |>
  summarize(resp=mean(resp)) |>
  mutate(Category=as.factor(Category)) |>
  ggplot(aes(x=condit,y=resp,fill=Category)) +
  geom_boxplot() +
  labs(y="Similarity Rating",x="2024 - Training Condition")


g3 <- cat_sim_test |>
  group_by(sbjCode,condit,Category,quartile) |>
  summarize(resp=mean(resp)) |>
  mutate(Category=as.factor(Category),quartile=factor(quartile,levels=c(1,2,3,4))) |>
  ggplot(aes(x=quartile,y=resp,fill=quartile)) +
  stat_bar+
 # geom_boxplot() +
  facet_wrap(~condit) +
  labs(y="Similarity Rating",x="Performance Quartile")

(g1/g2/g3) + plot_annotation(title="Similarity Rating breakdowns") +
  plot_layout(heights = c(1,1,2))
```
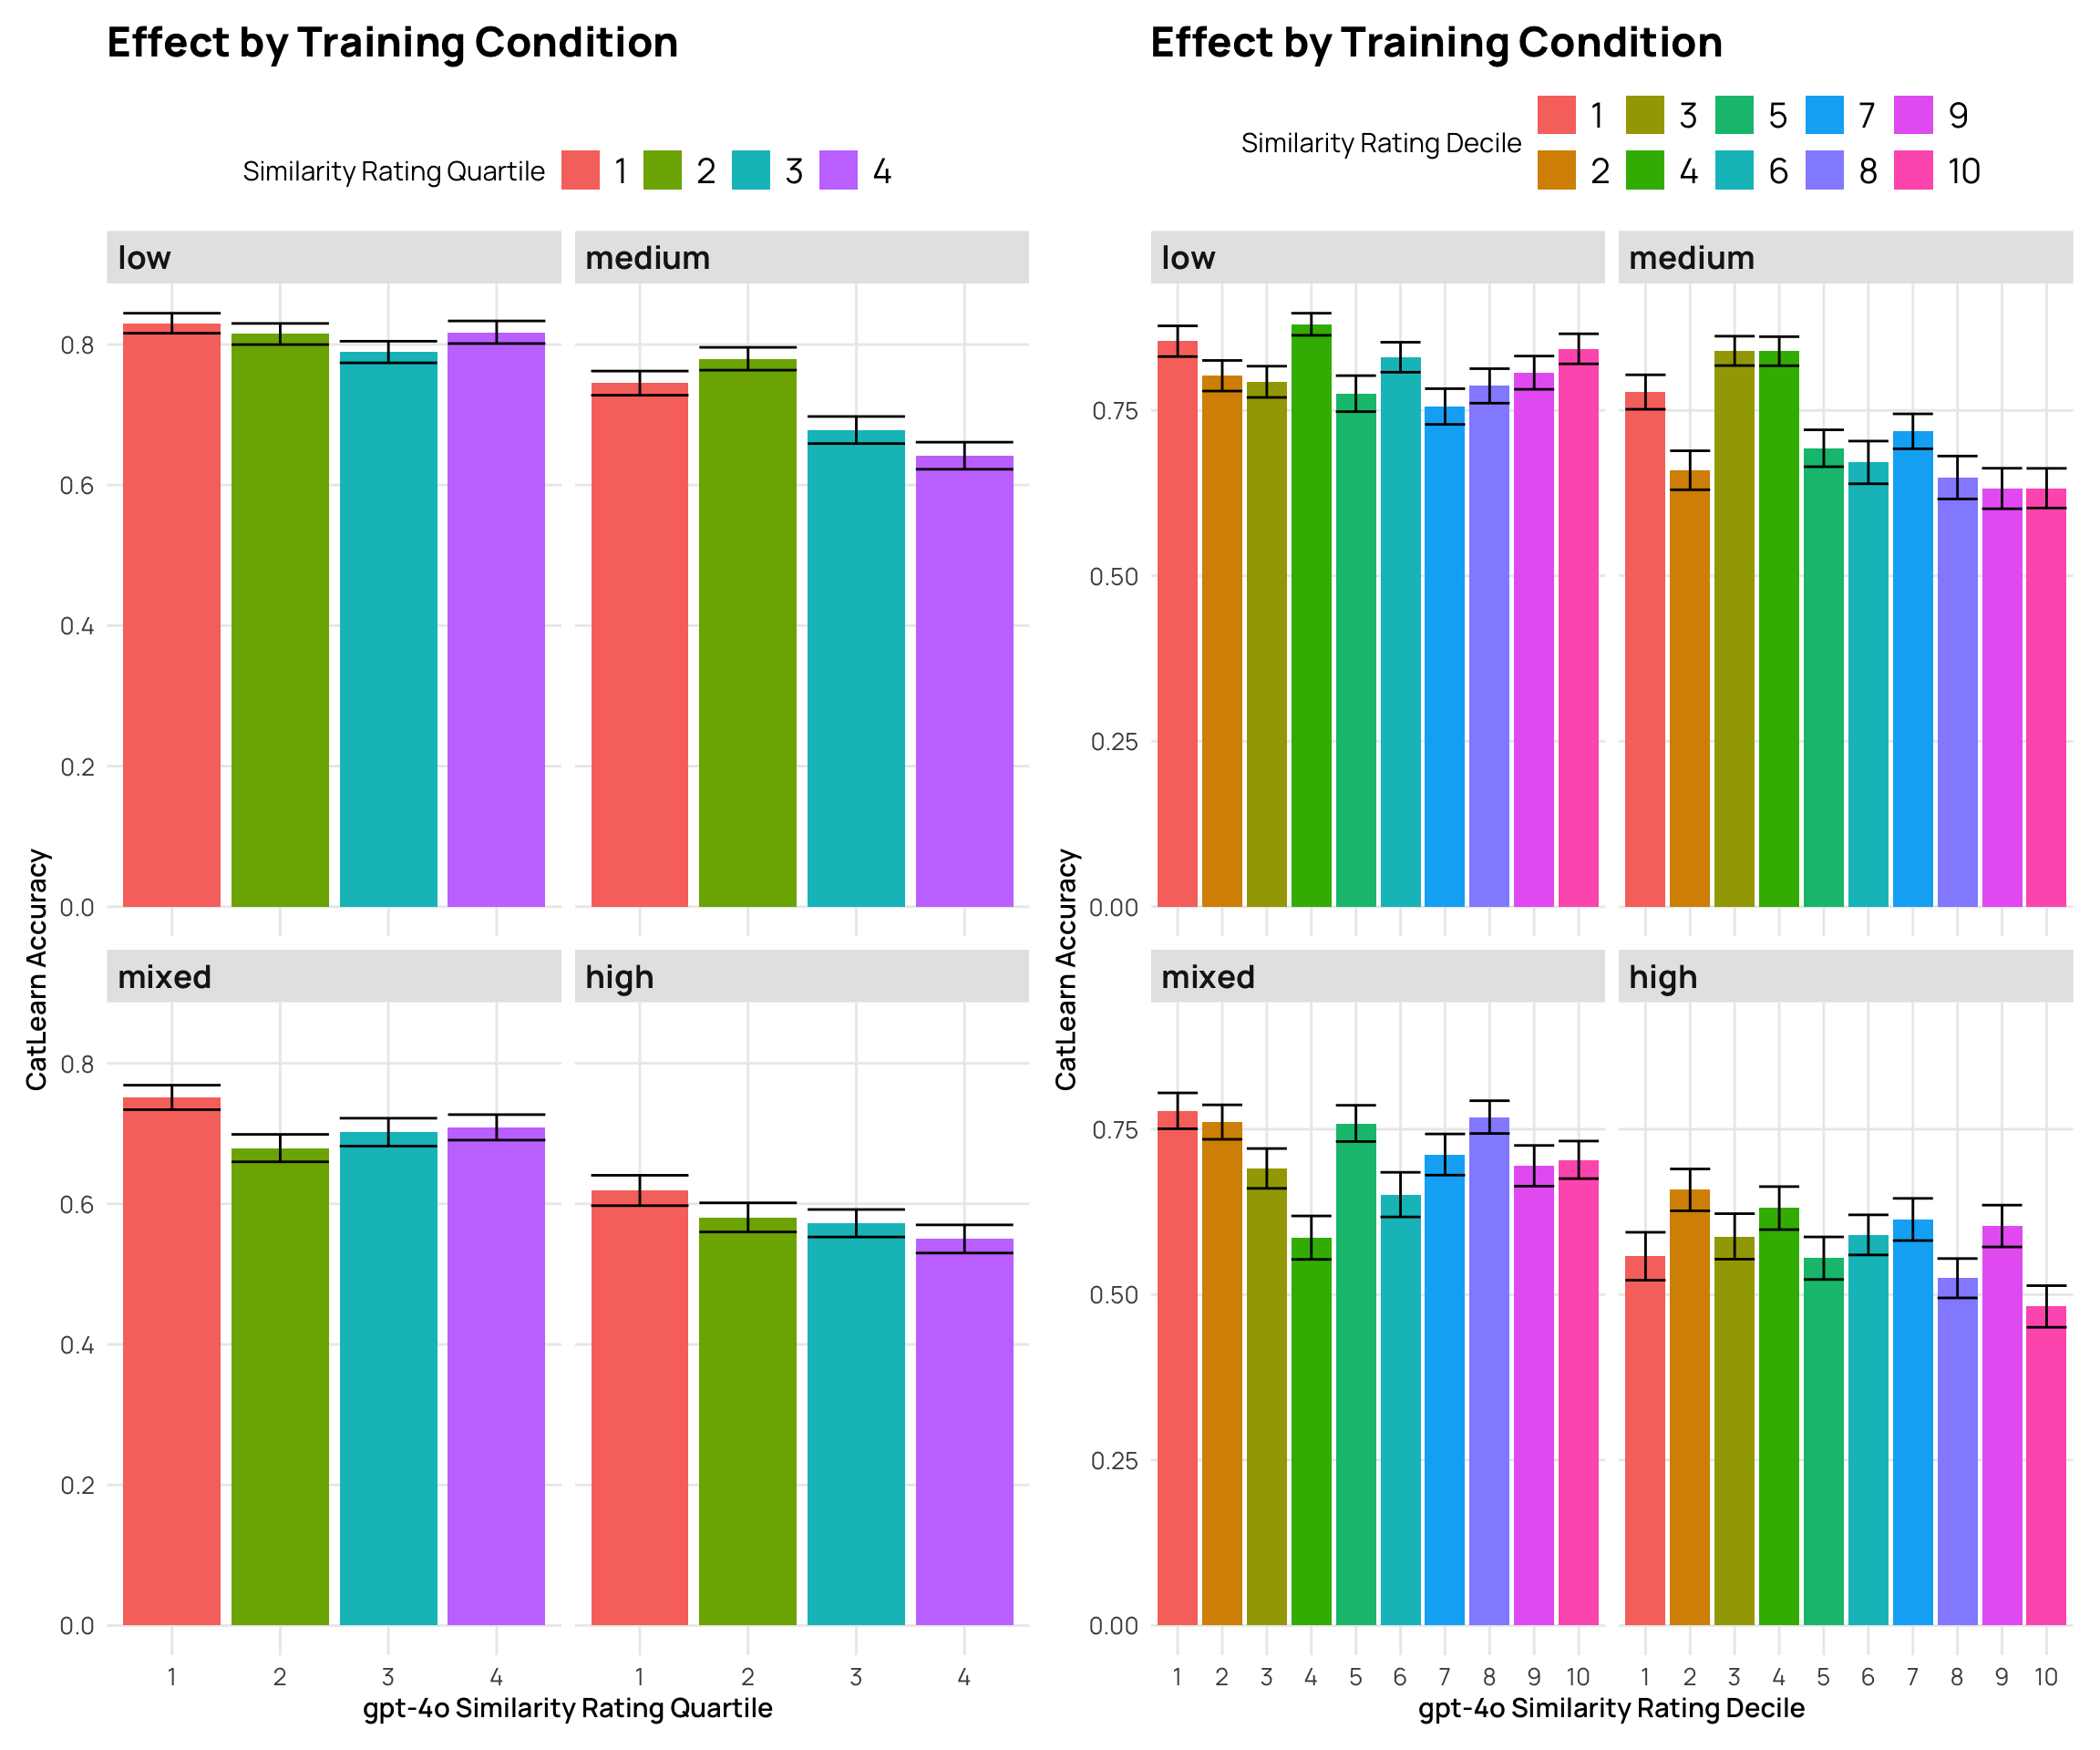
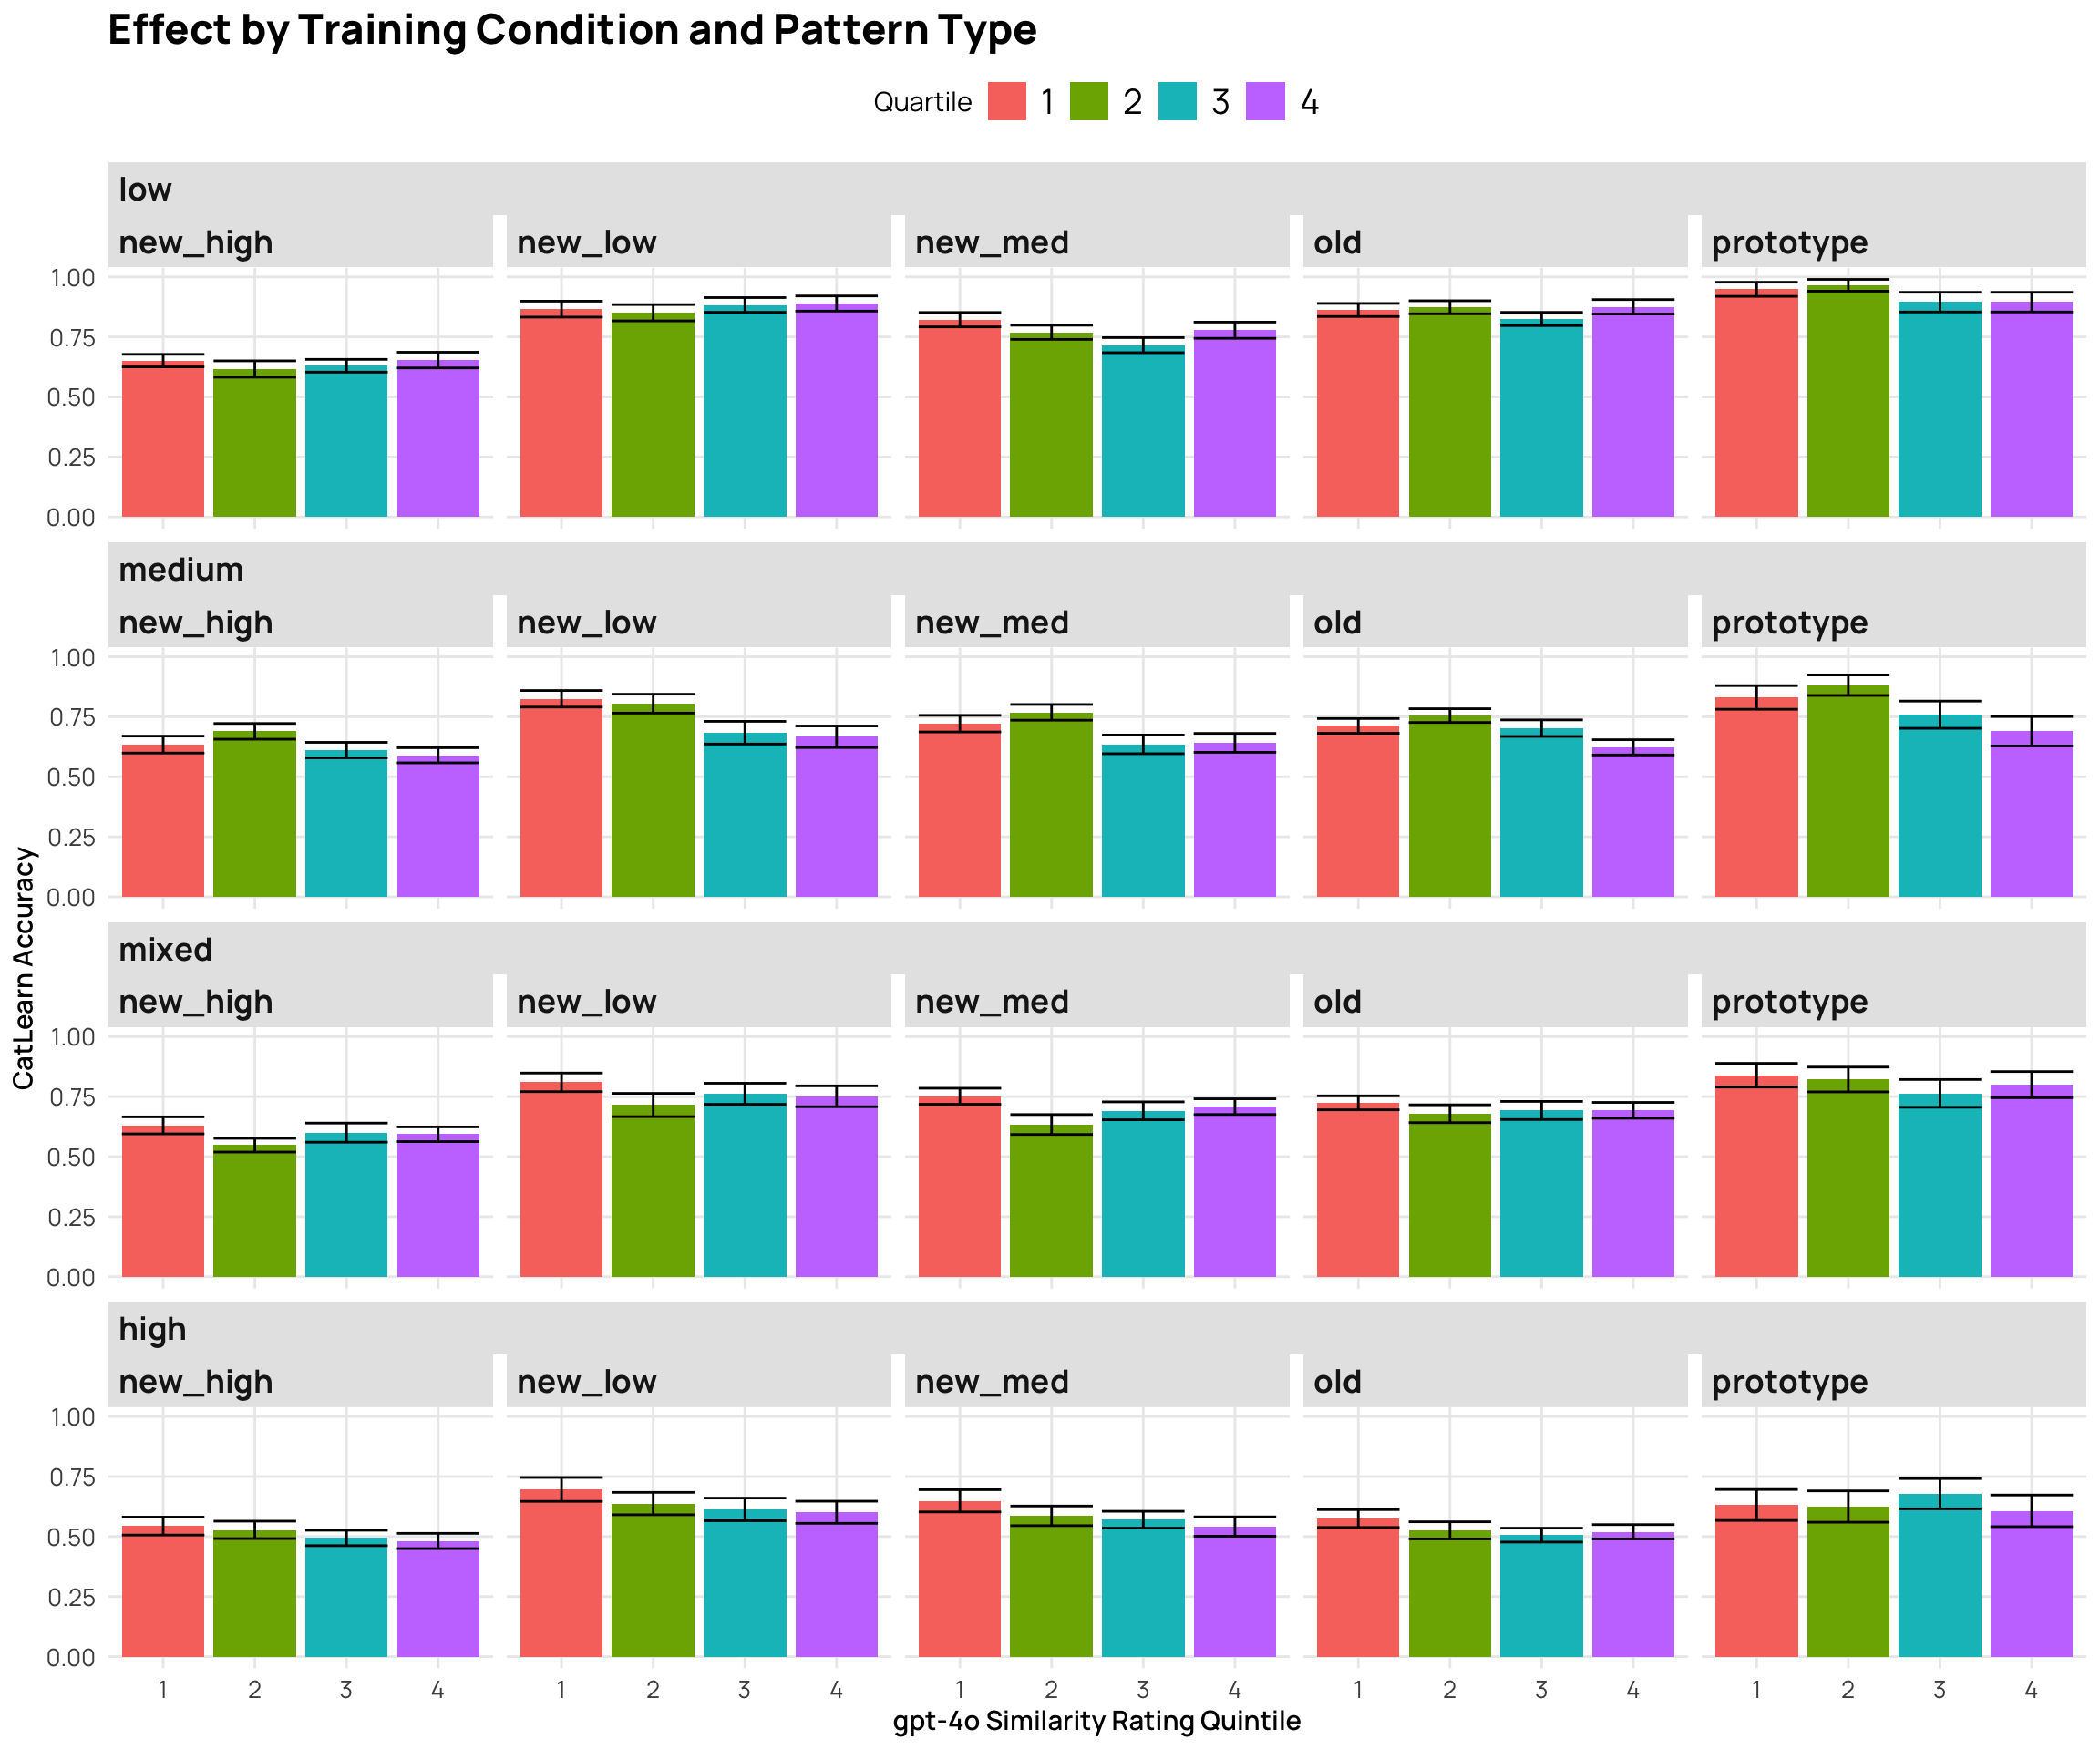
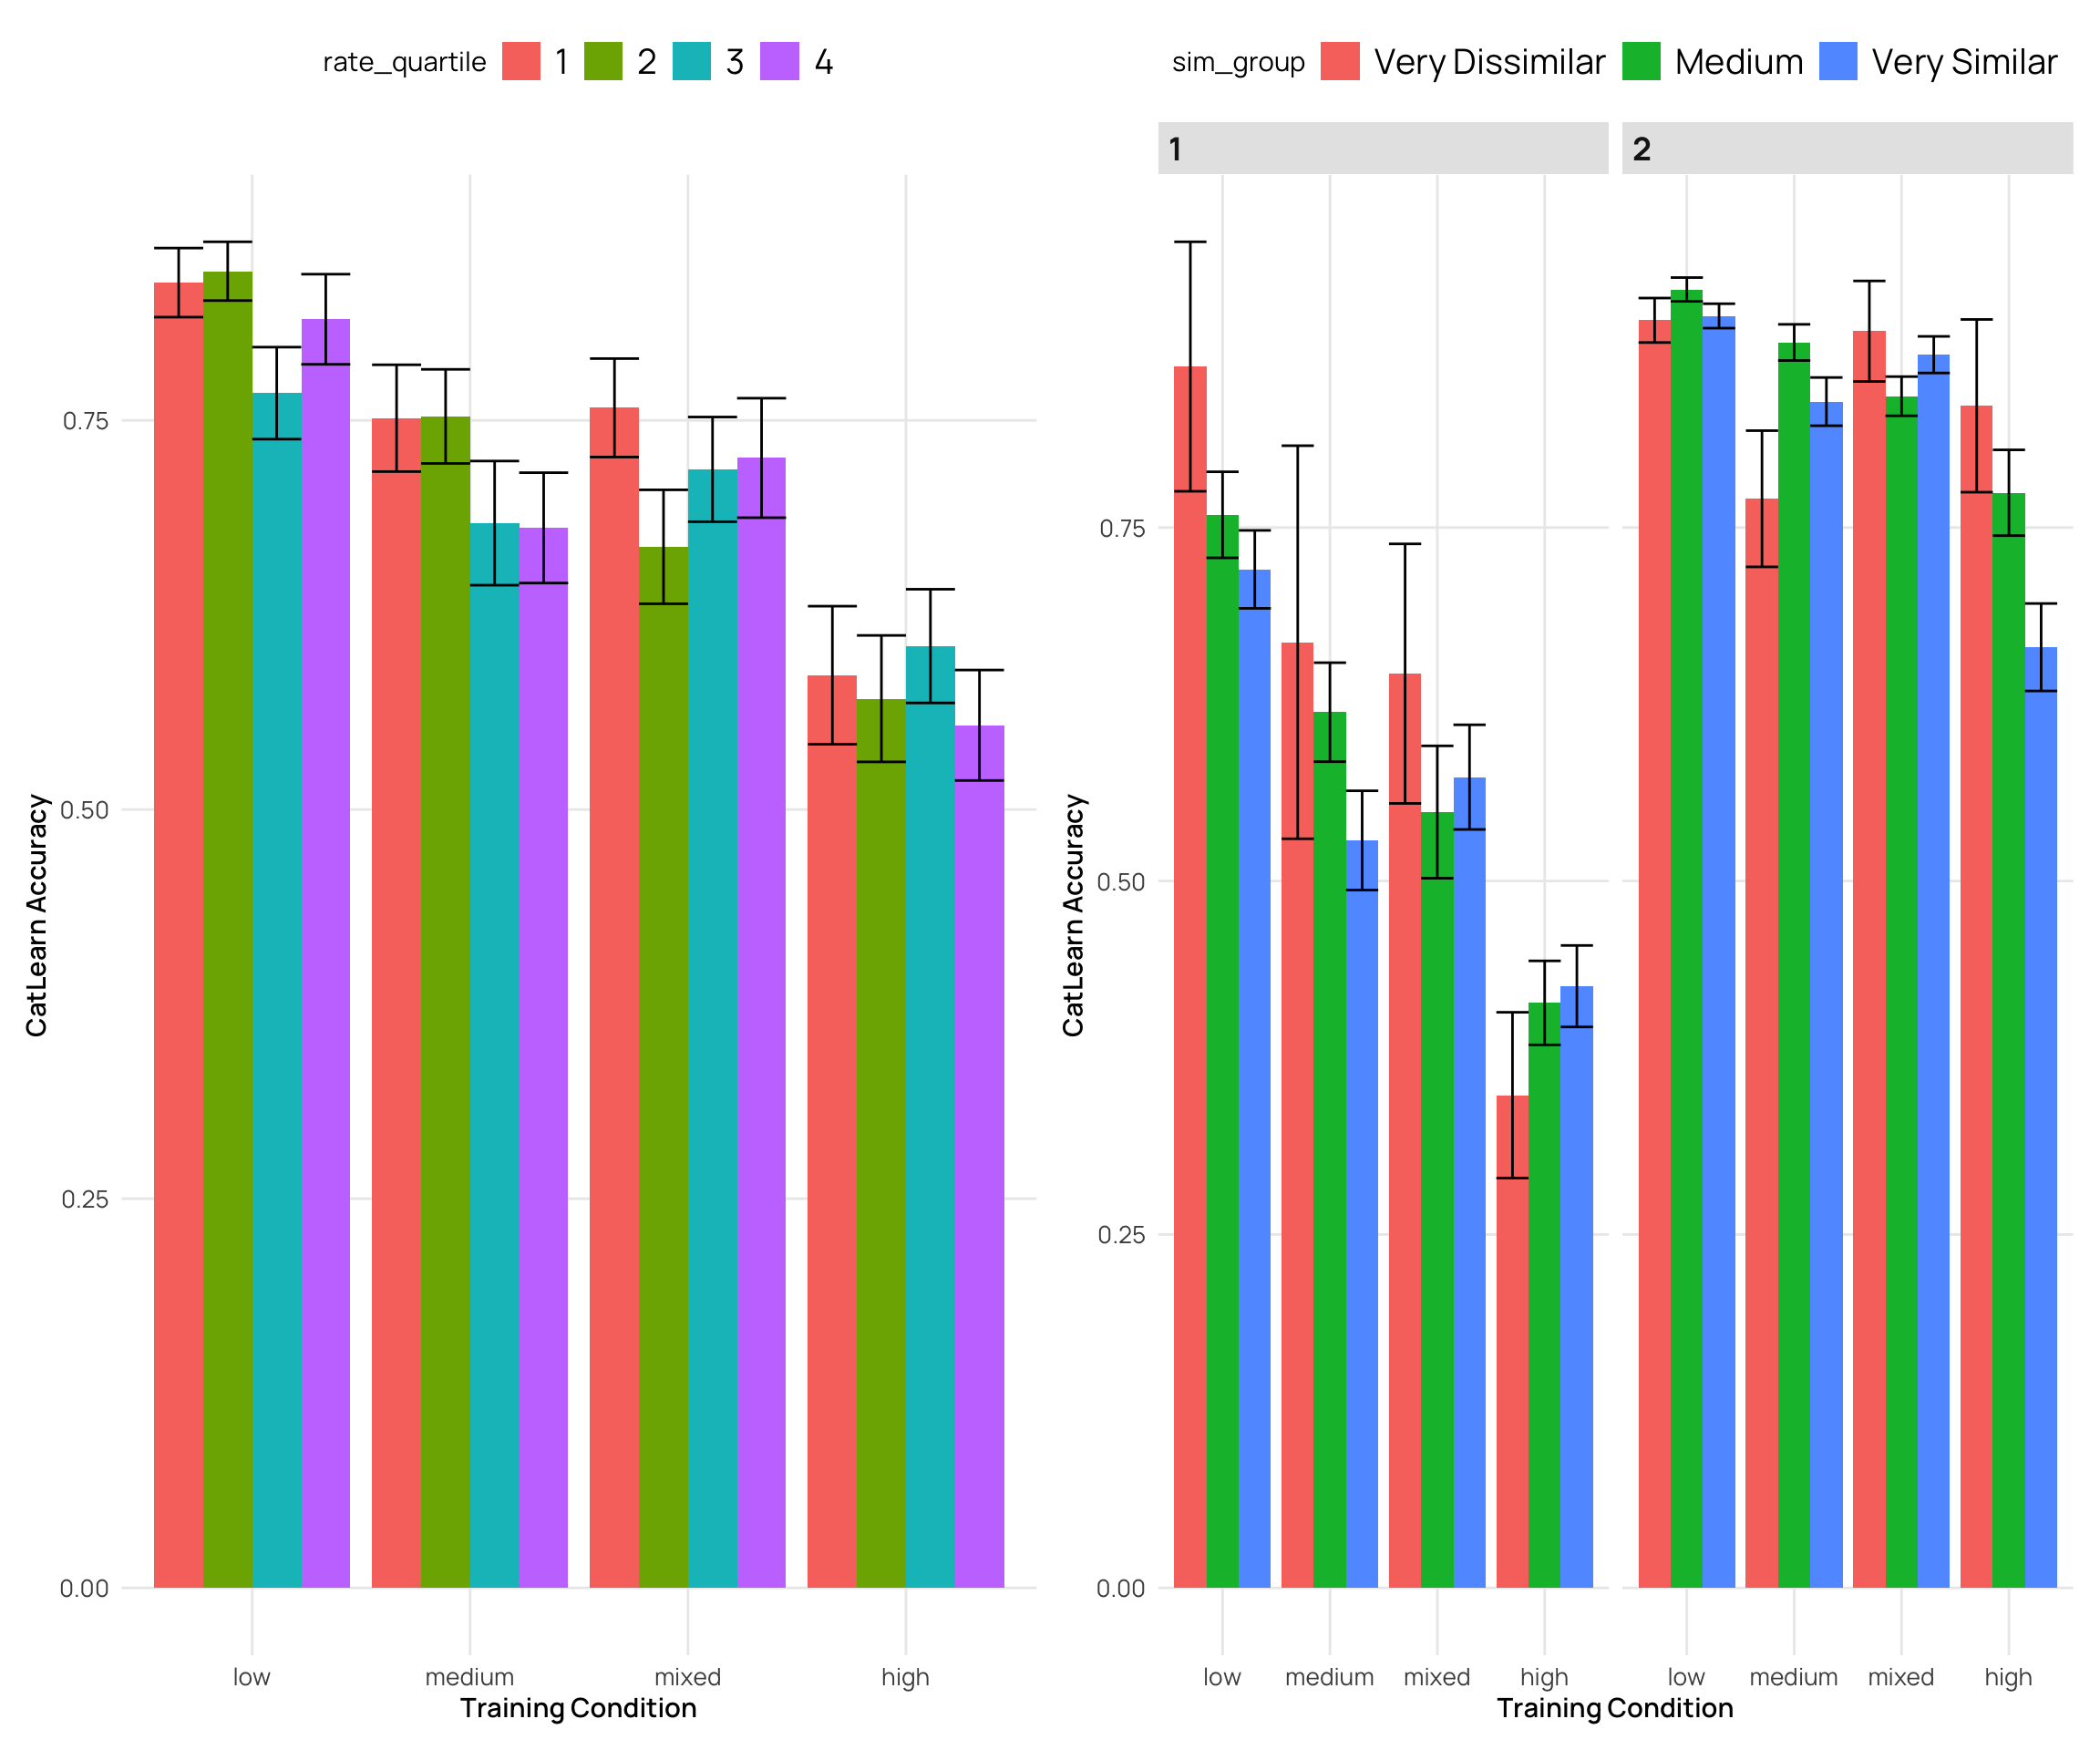
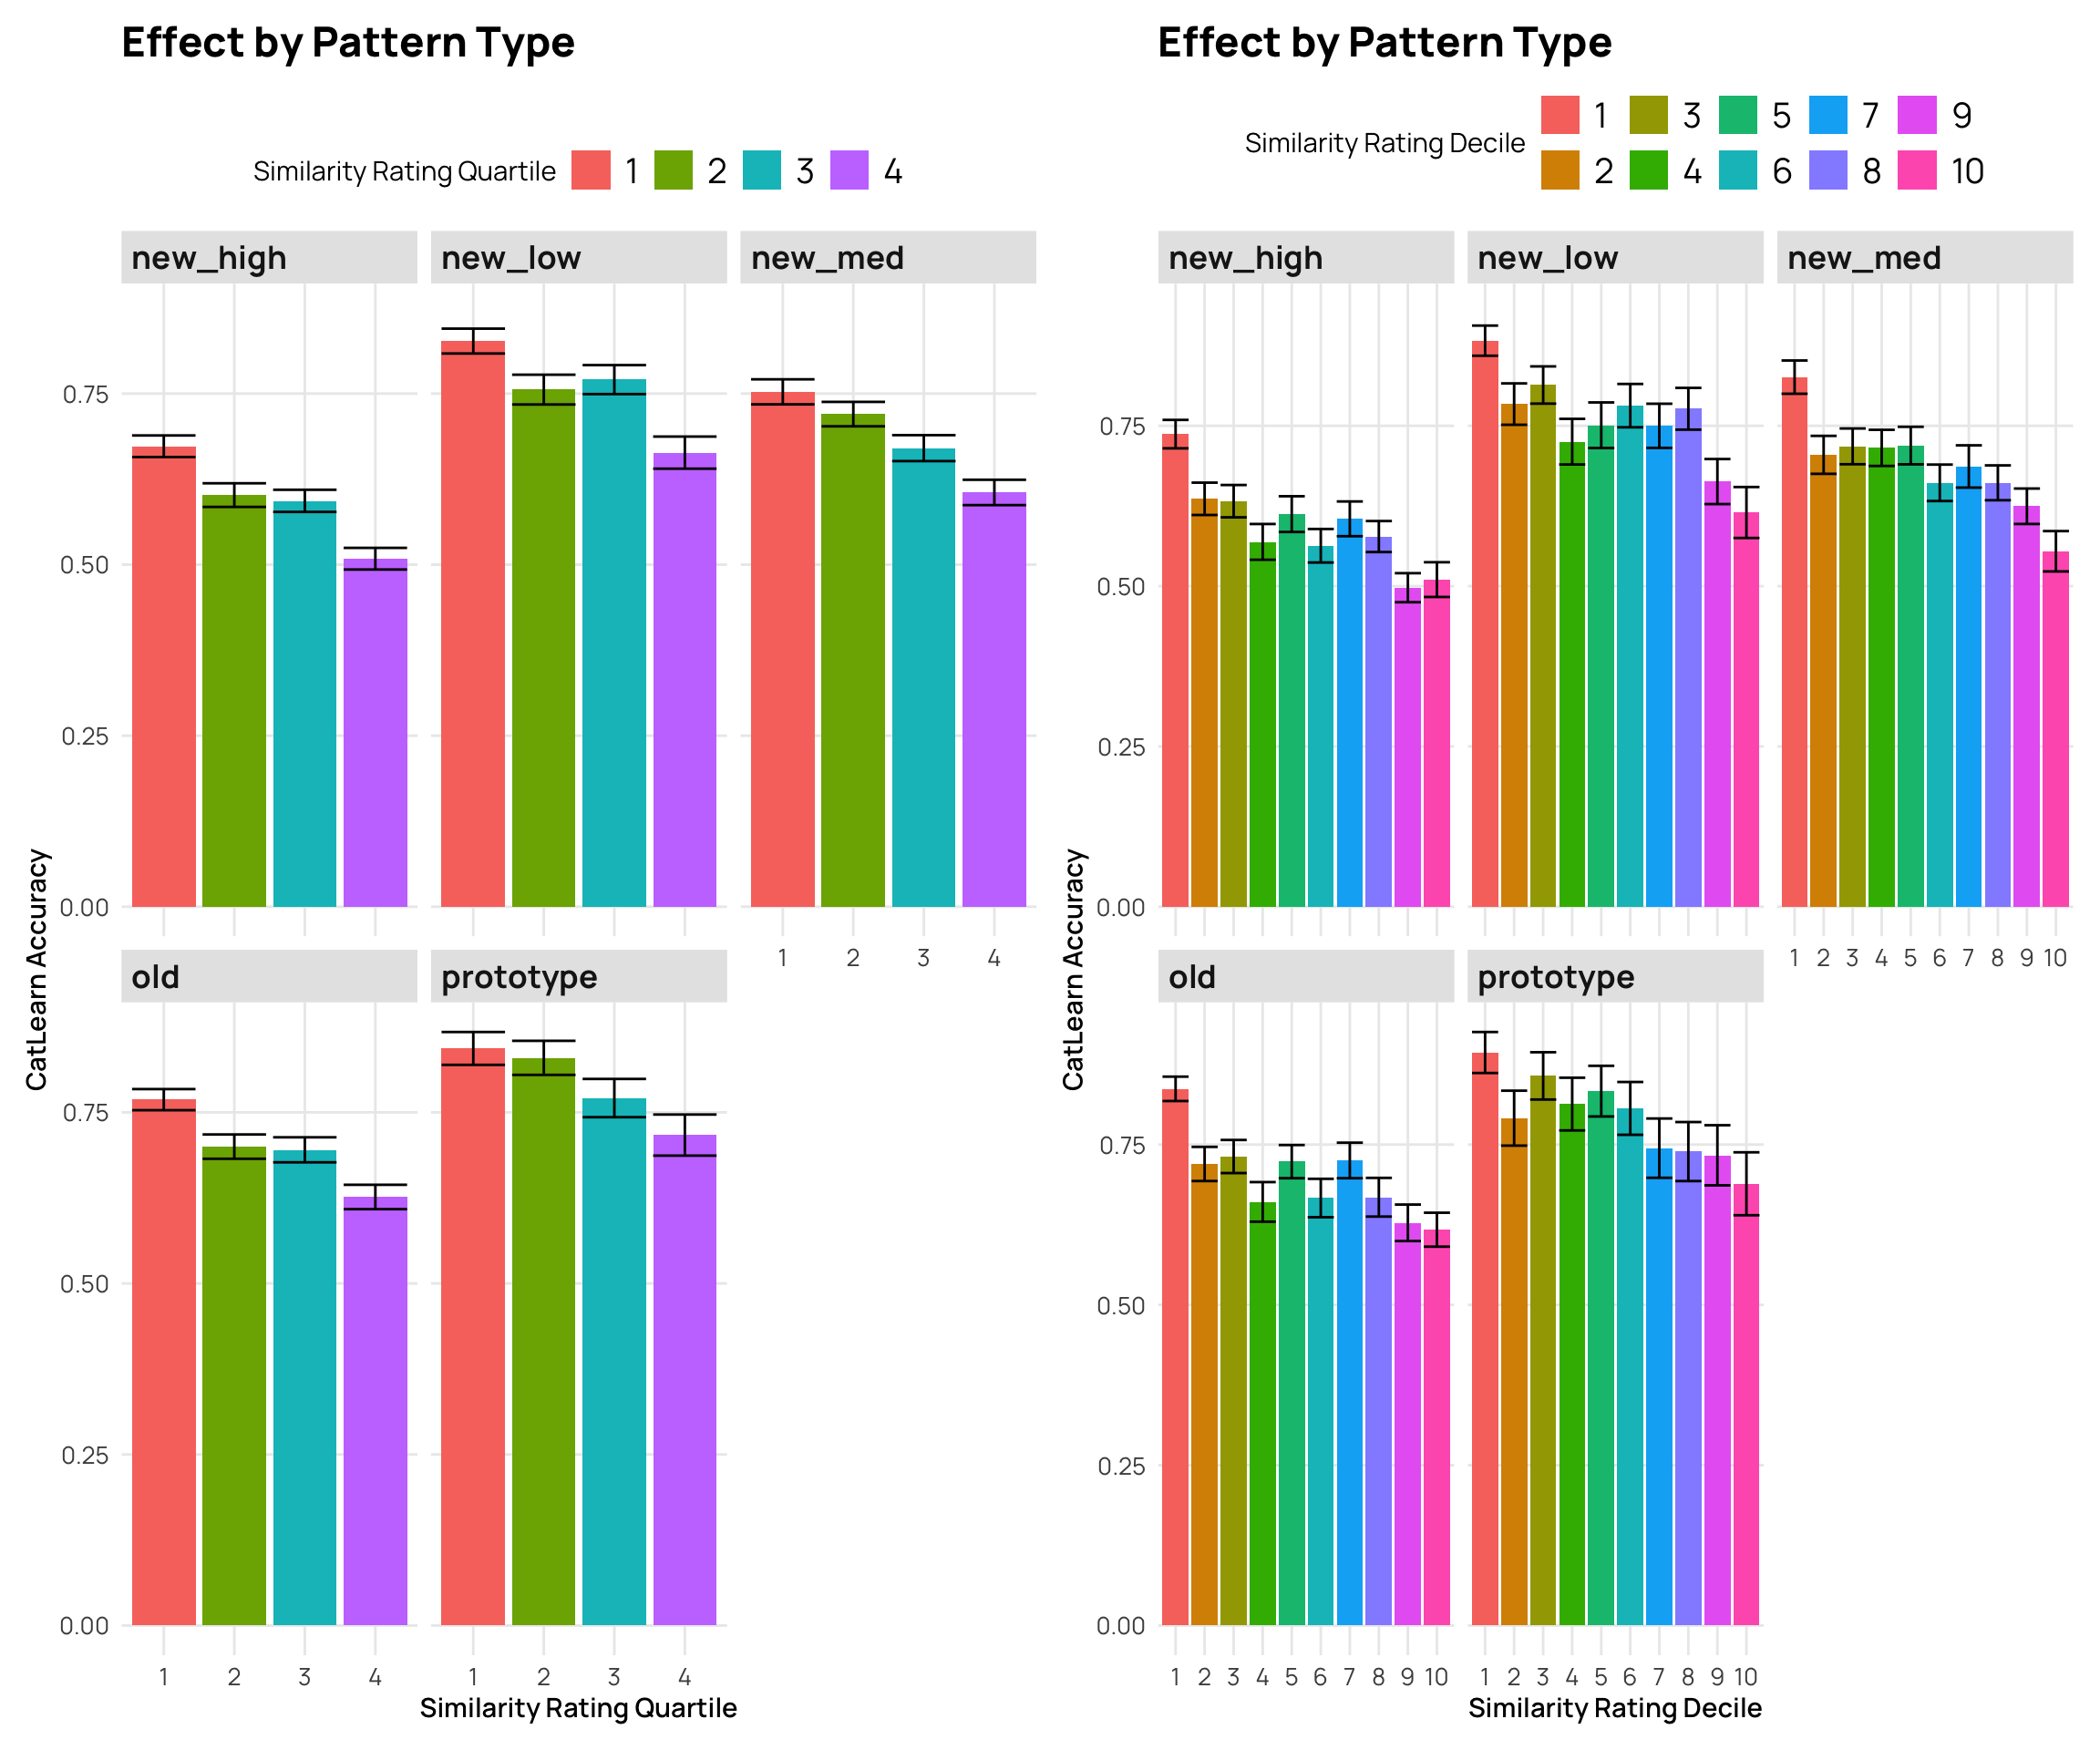
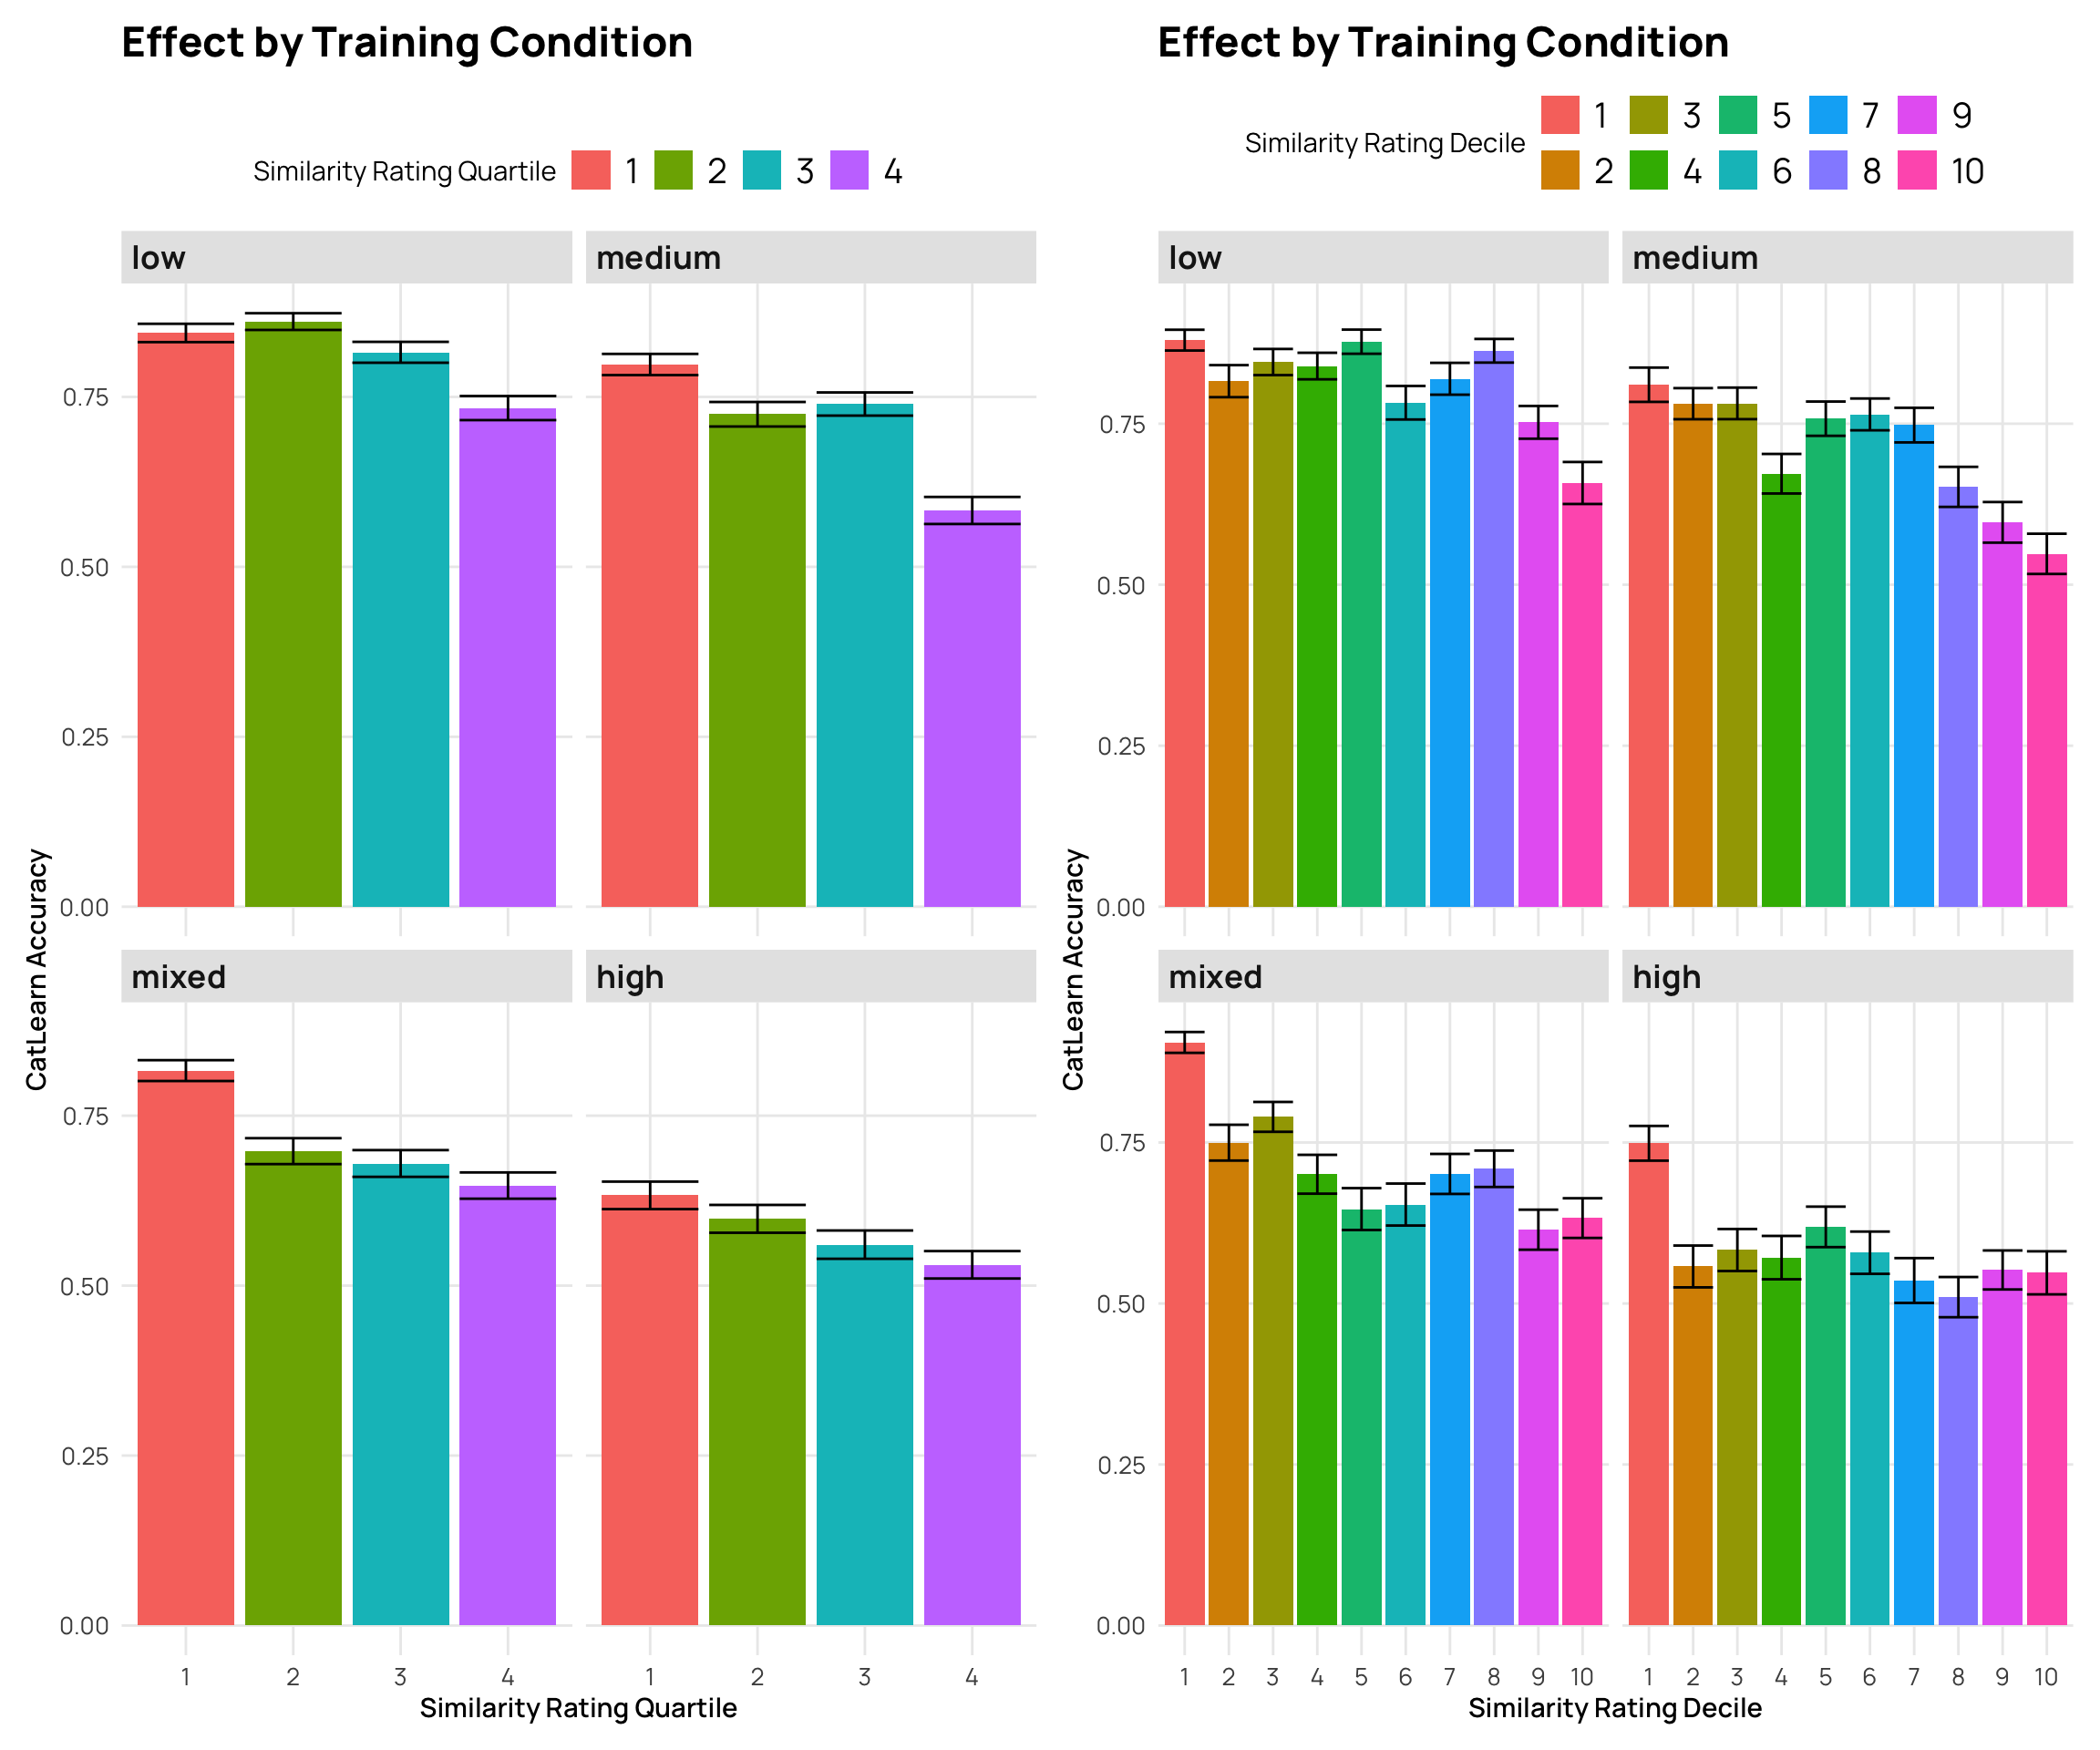
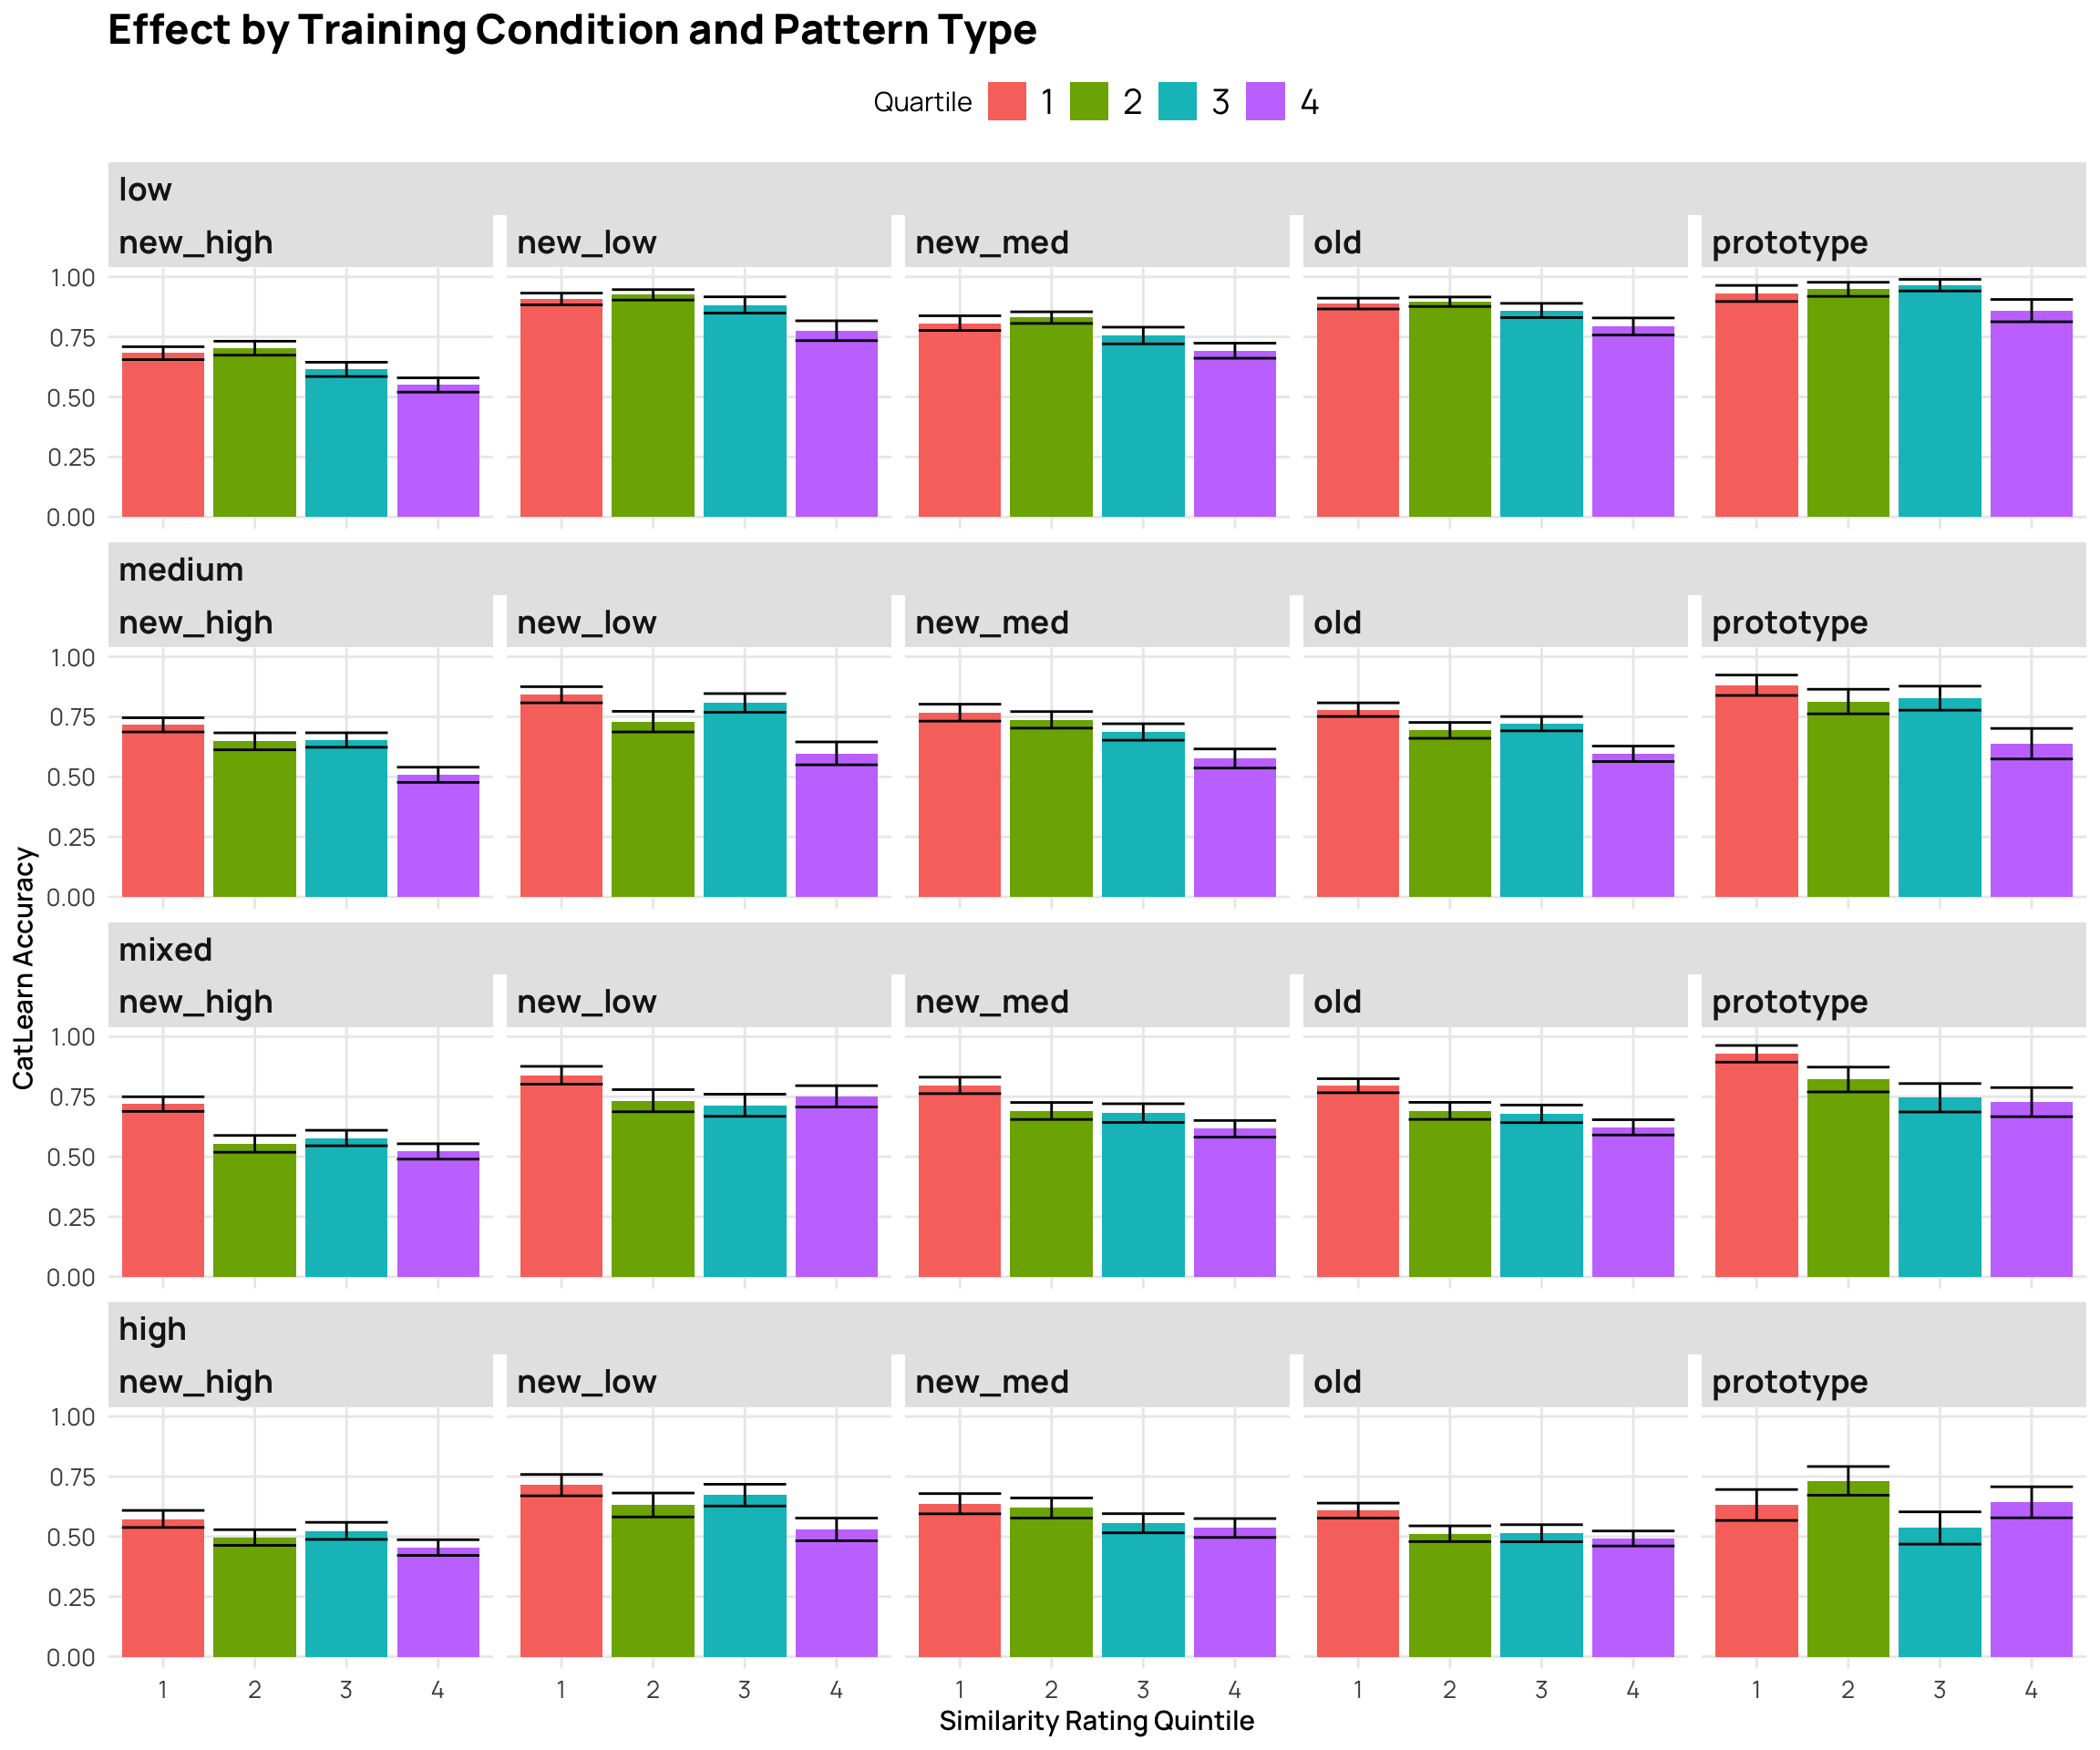
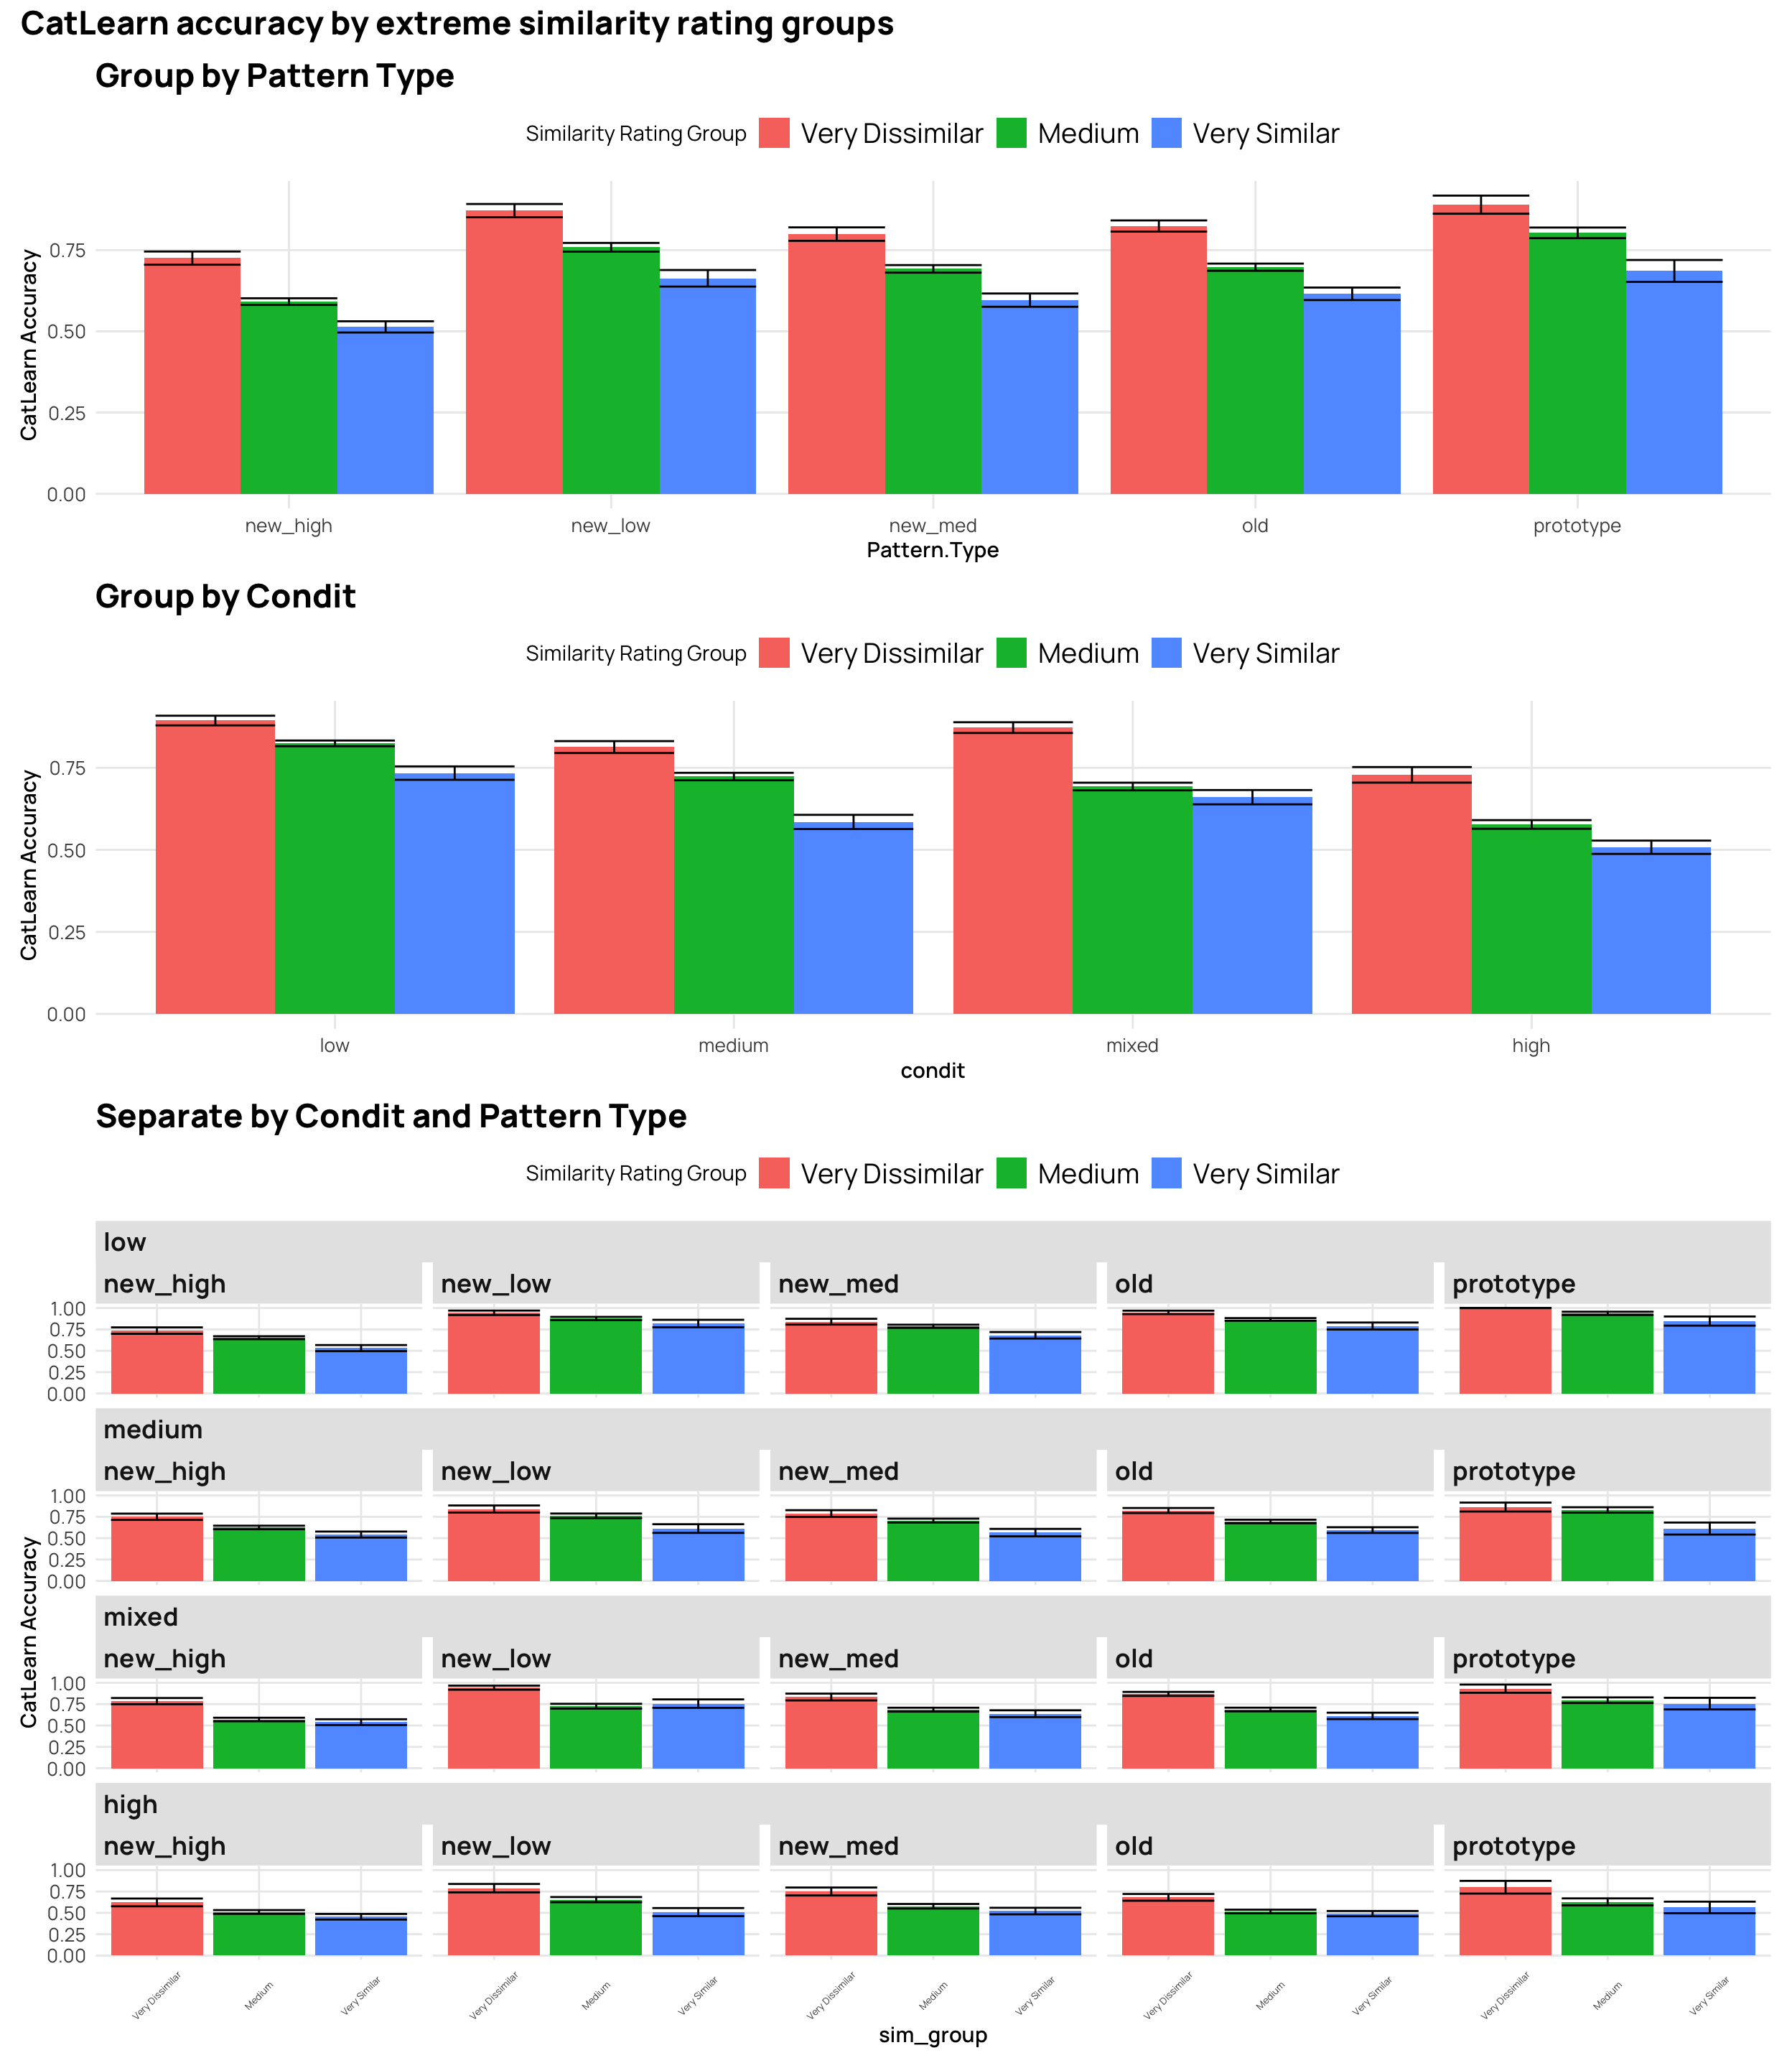
### Relationship between catLearn accuracy and binnings of similarity rating
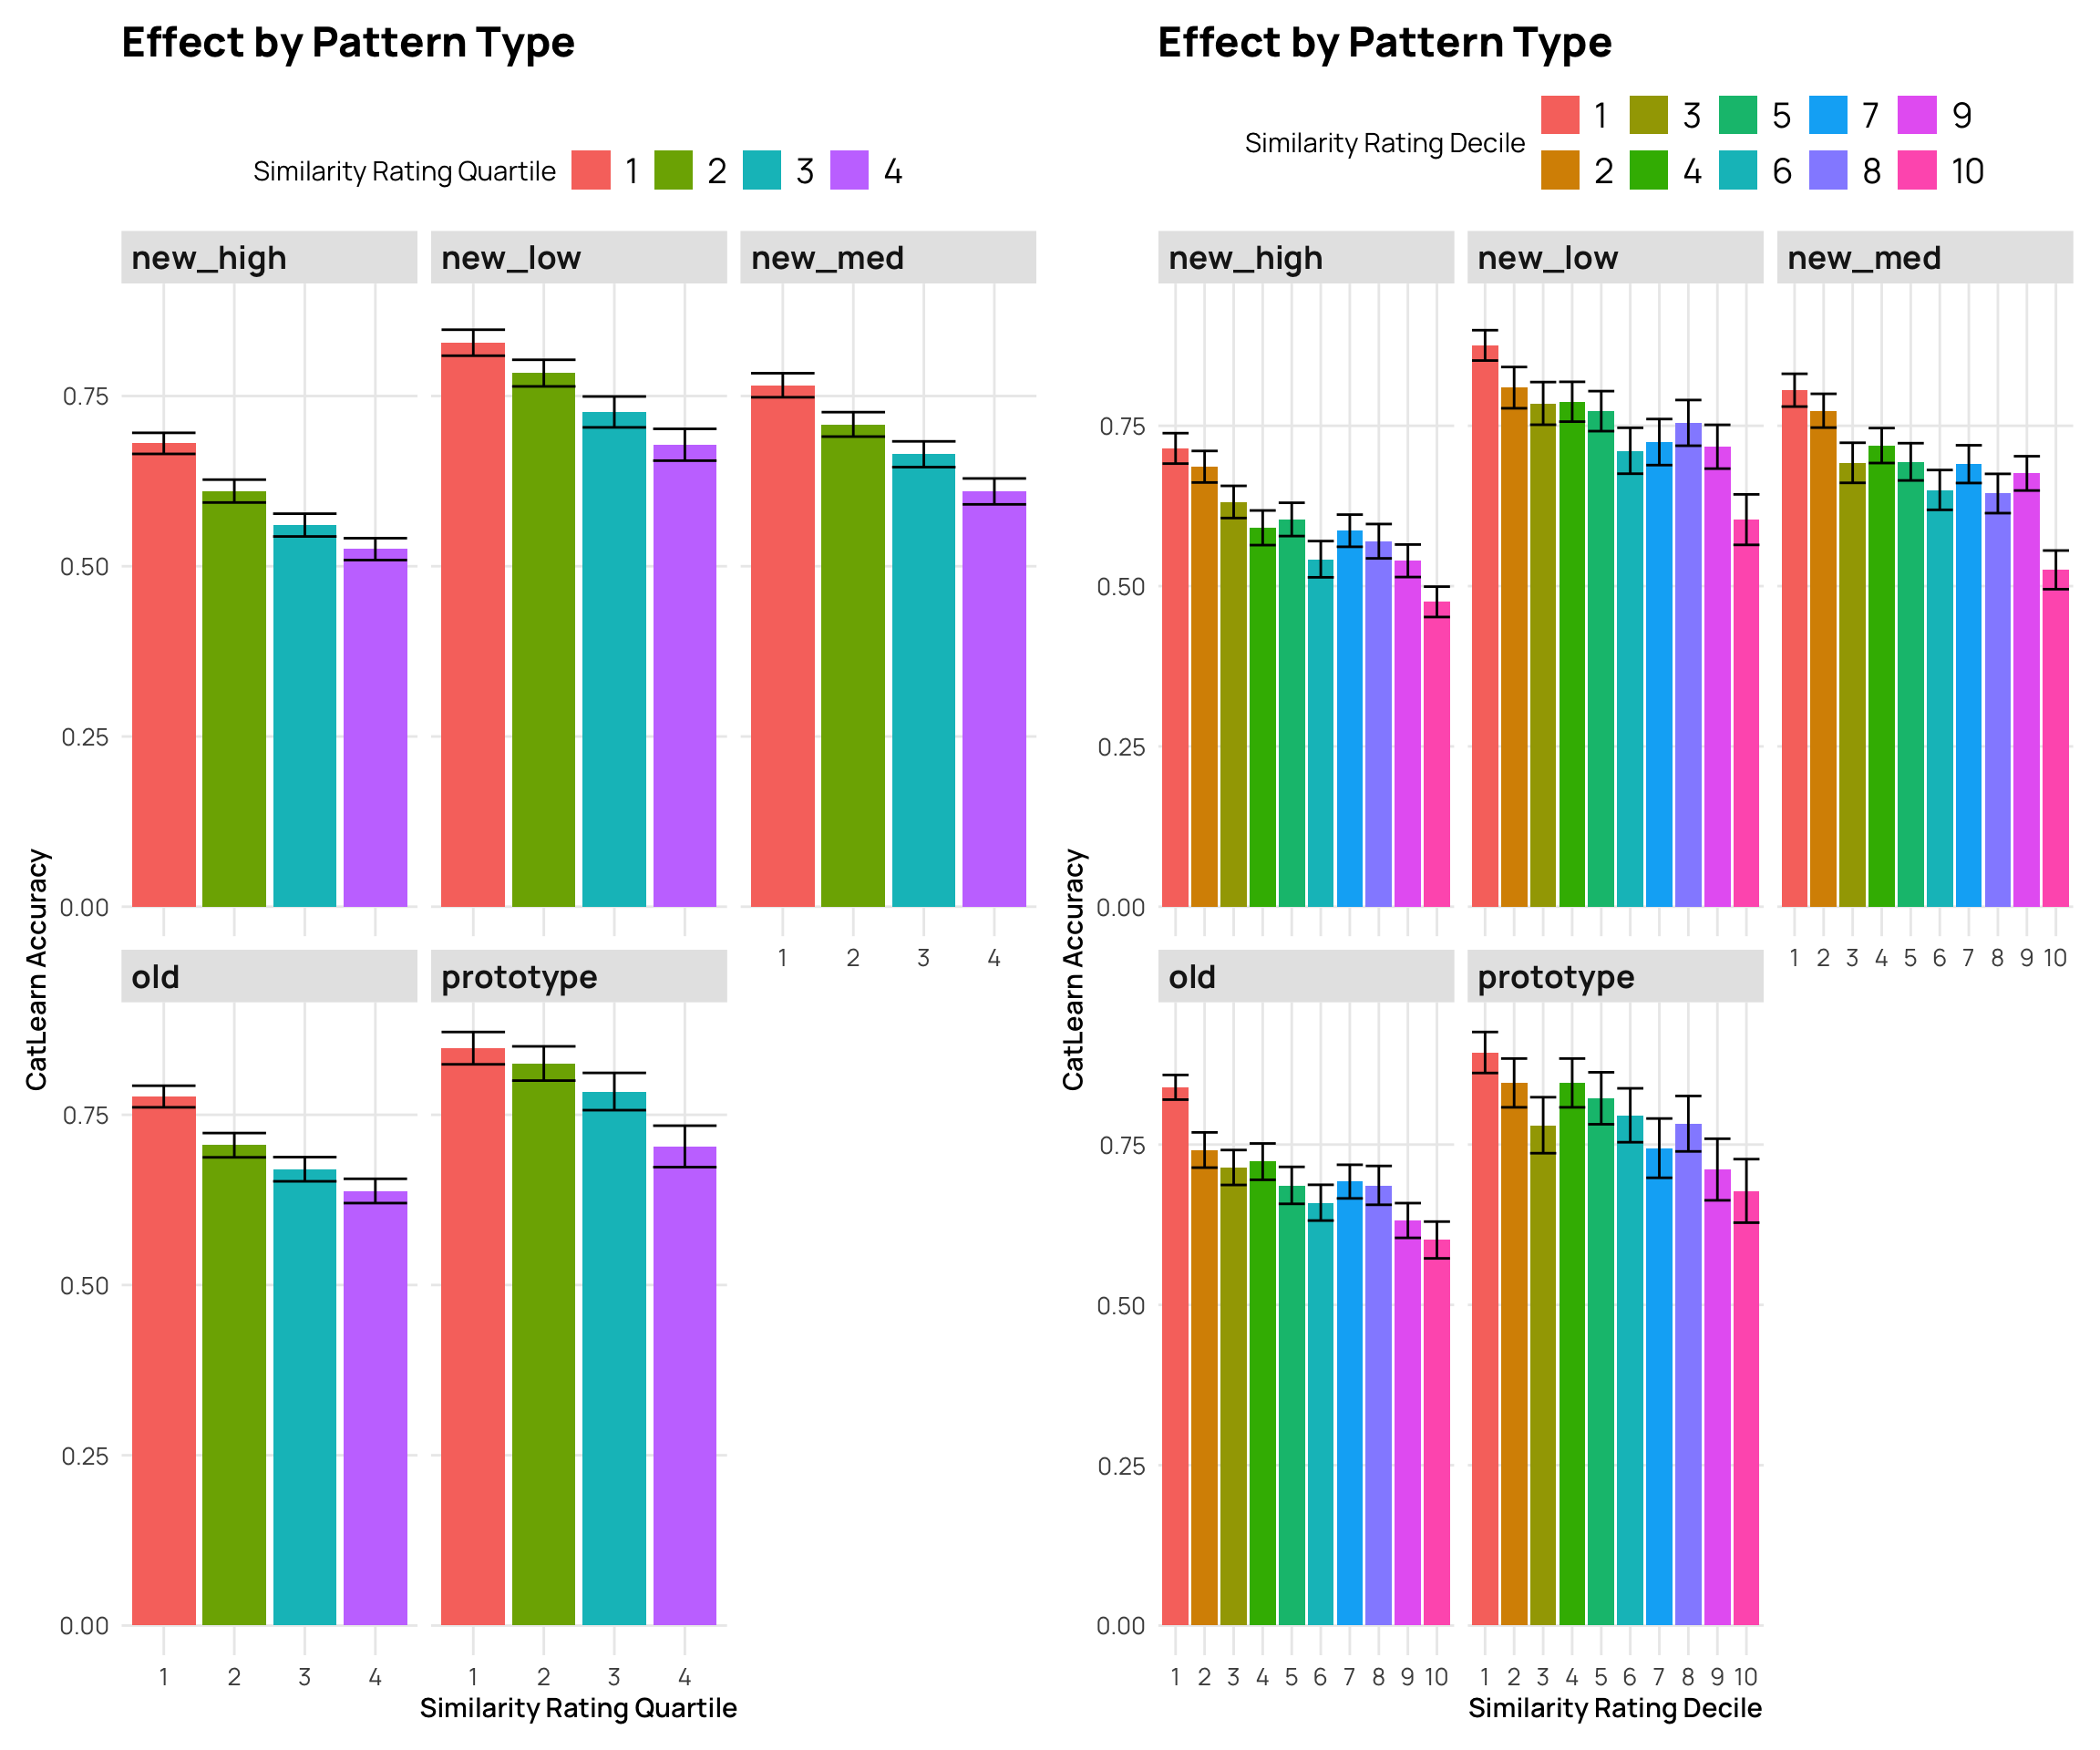
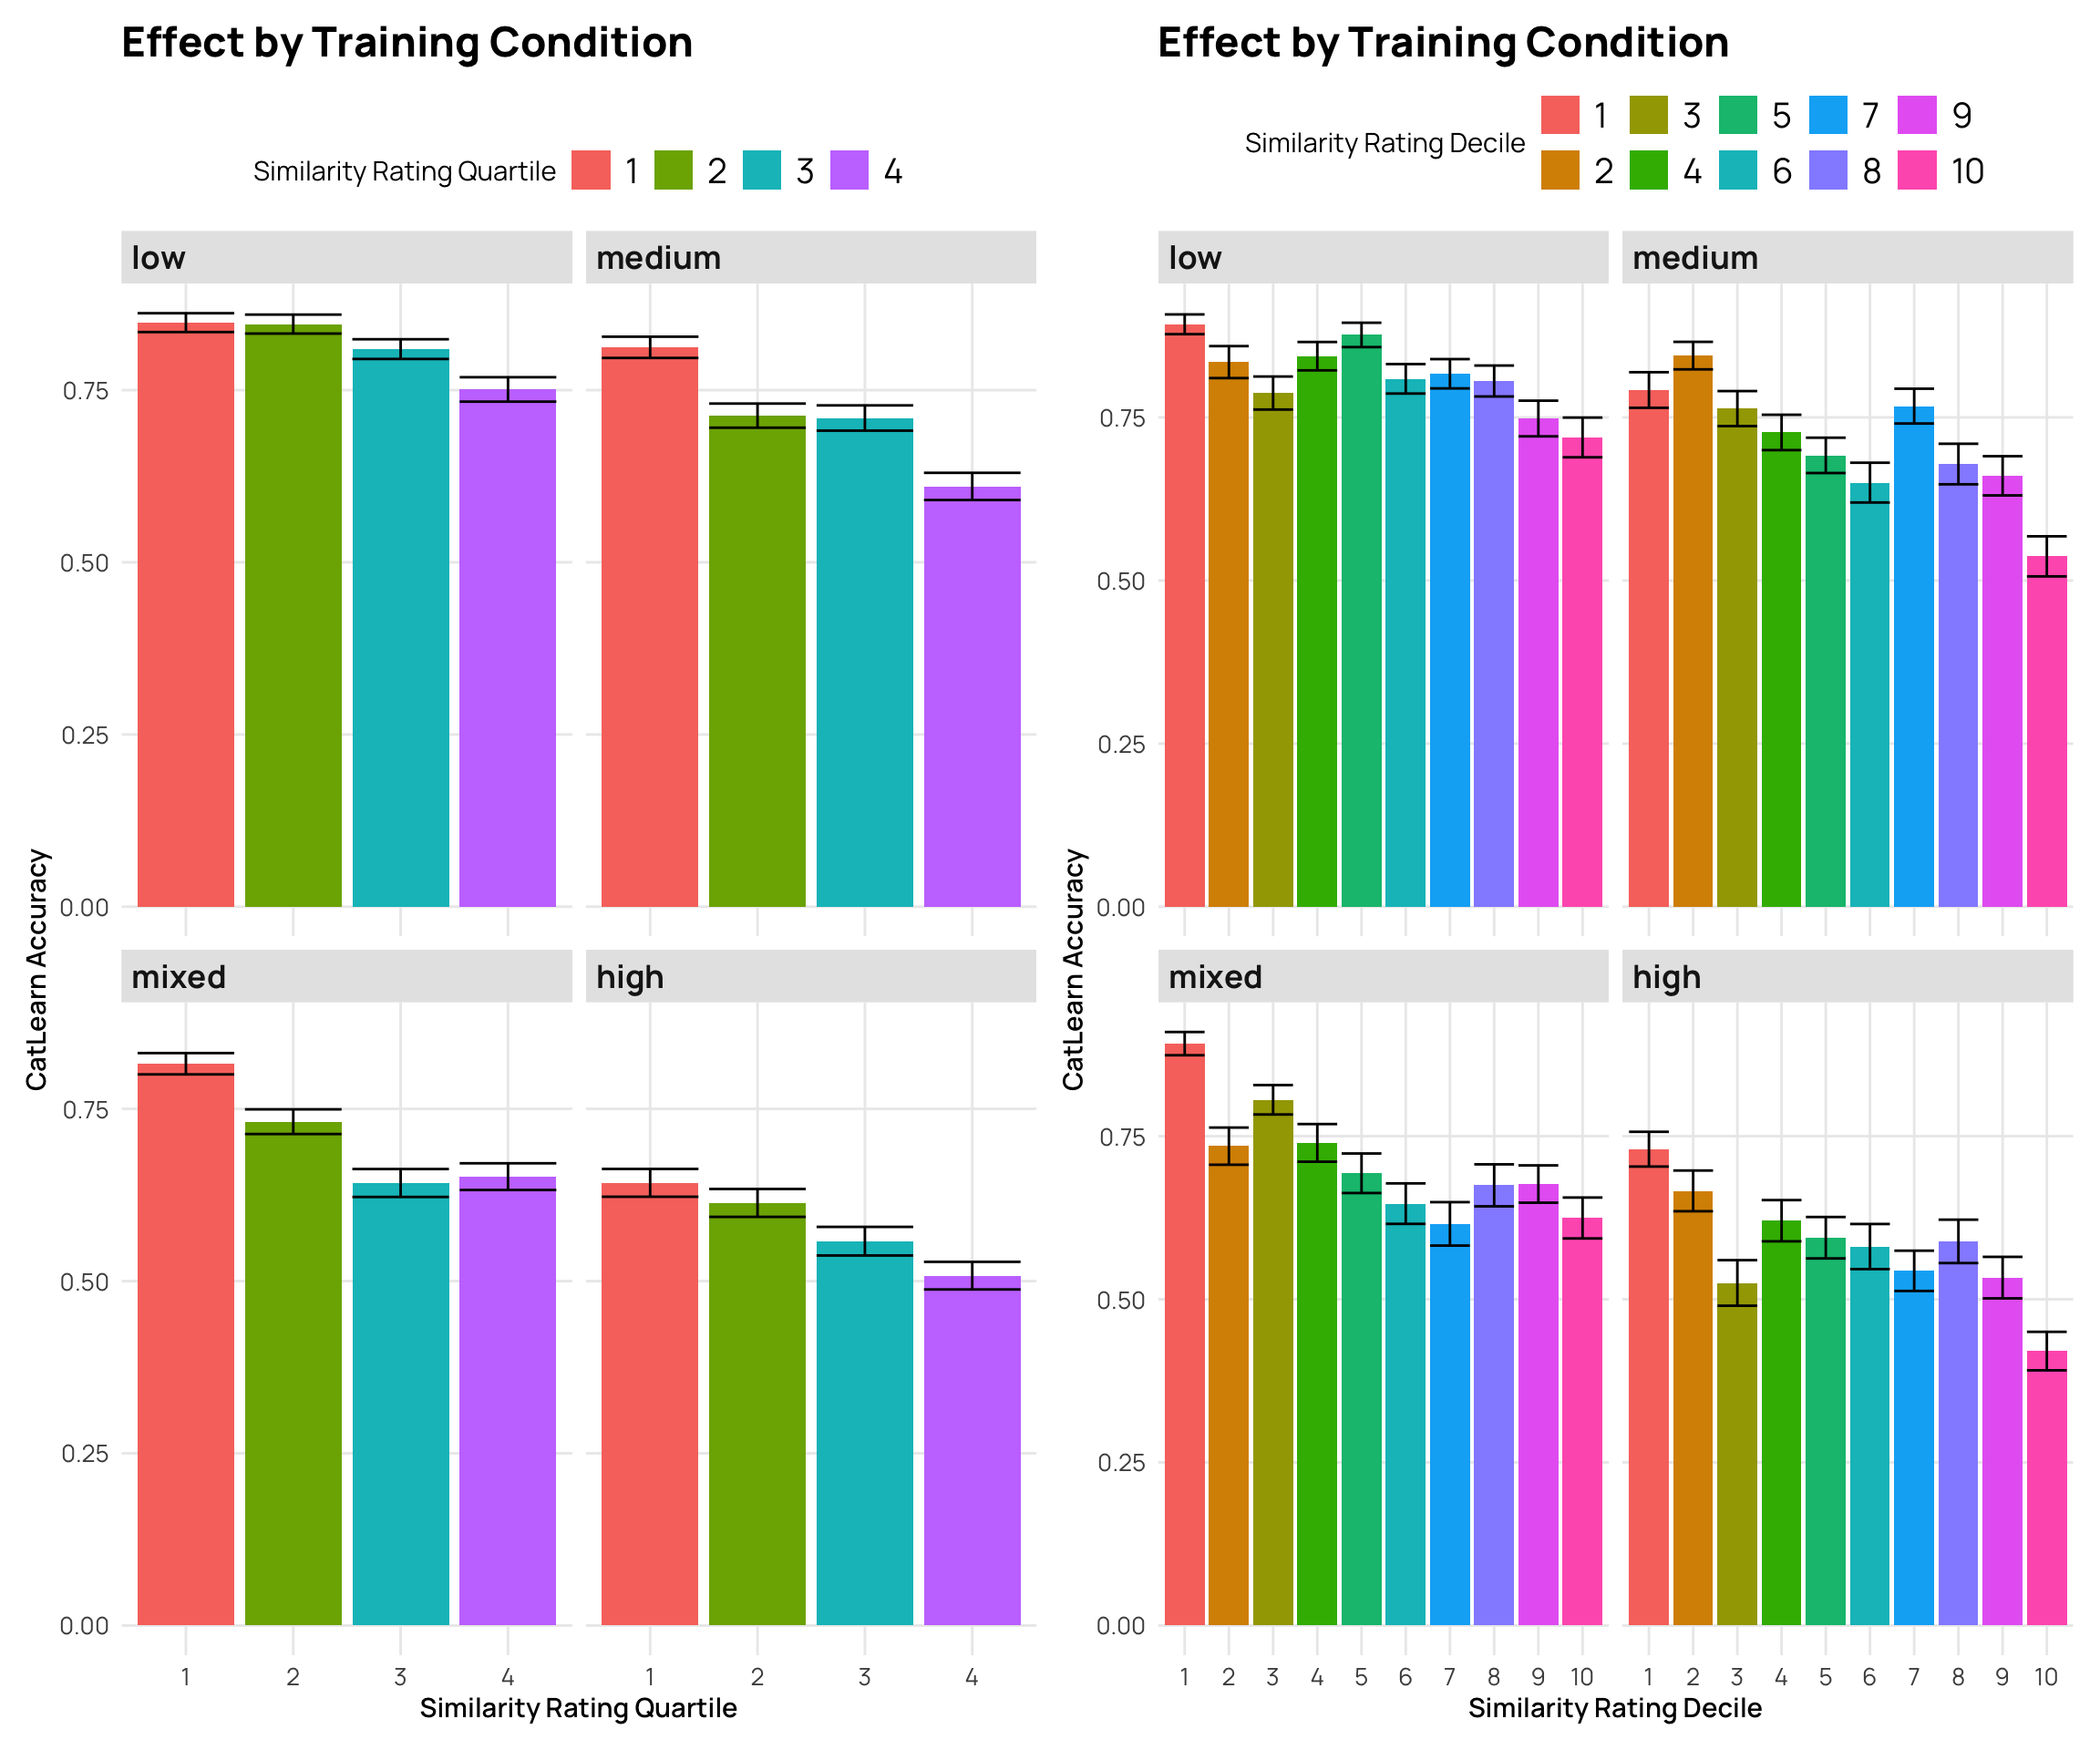
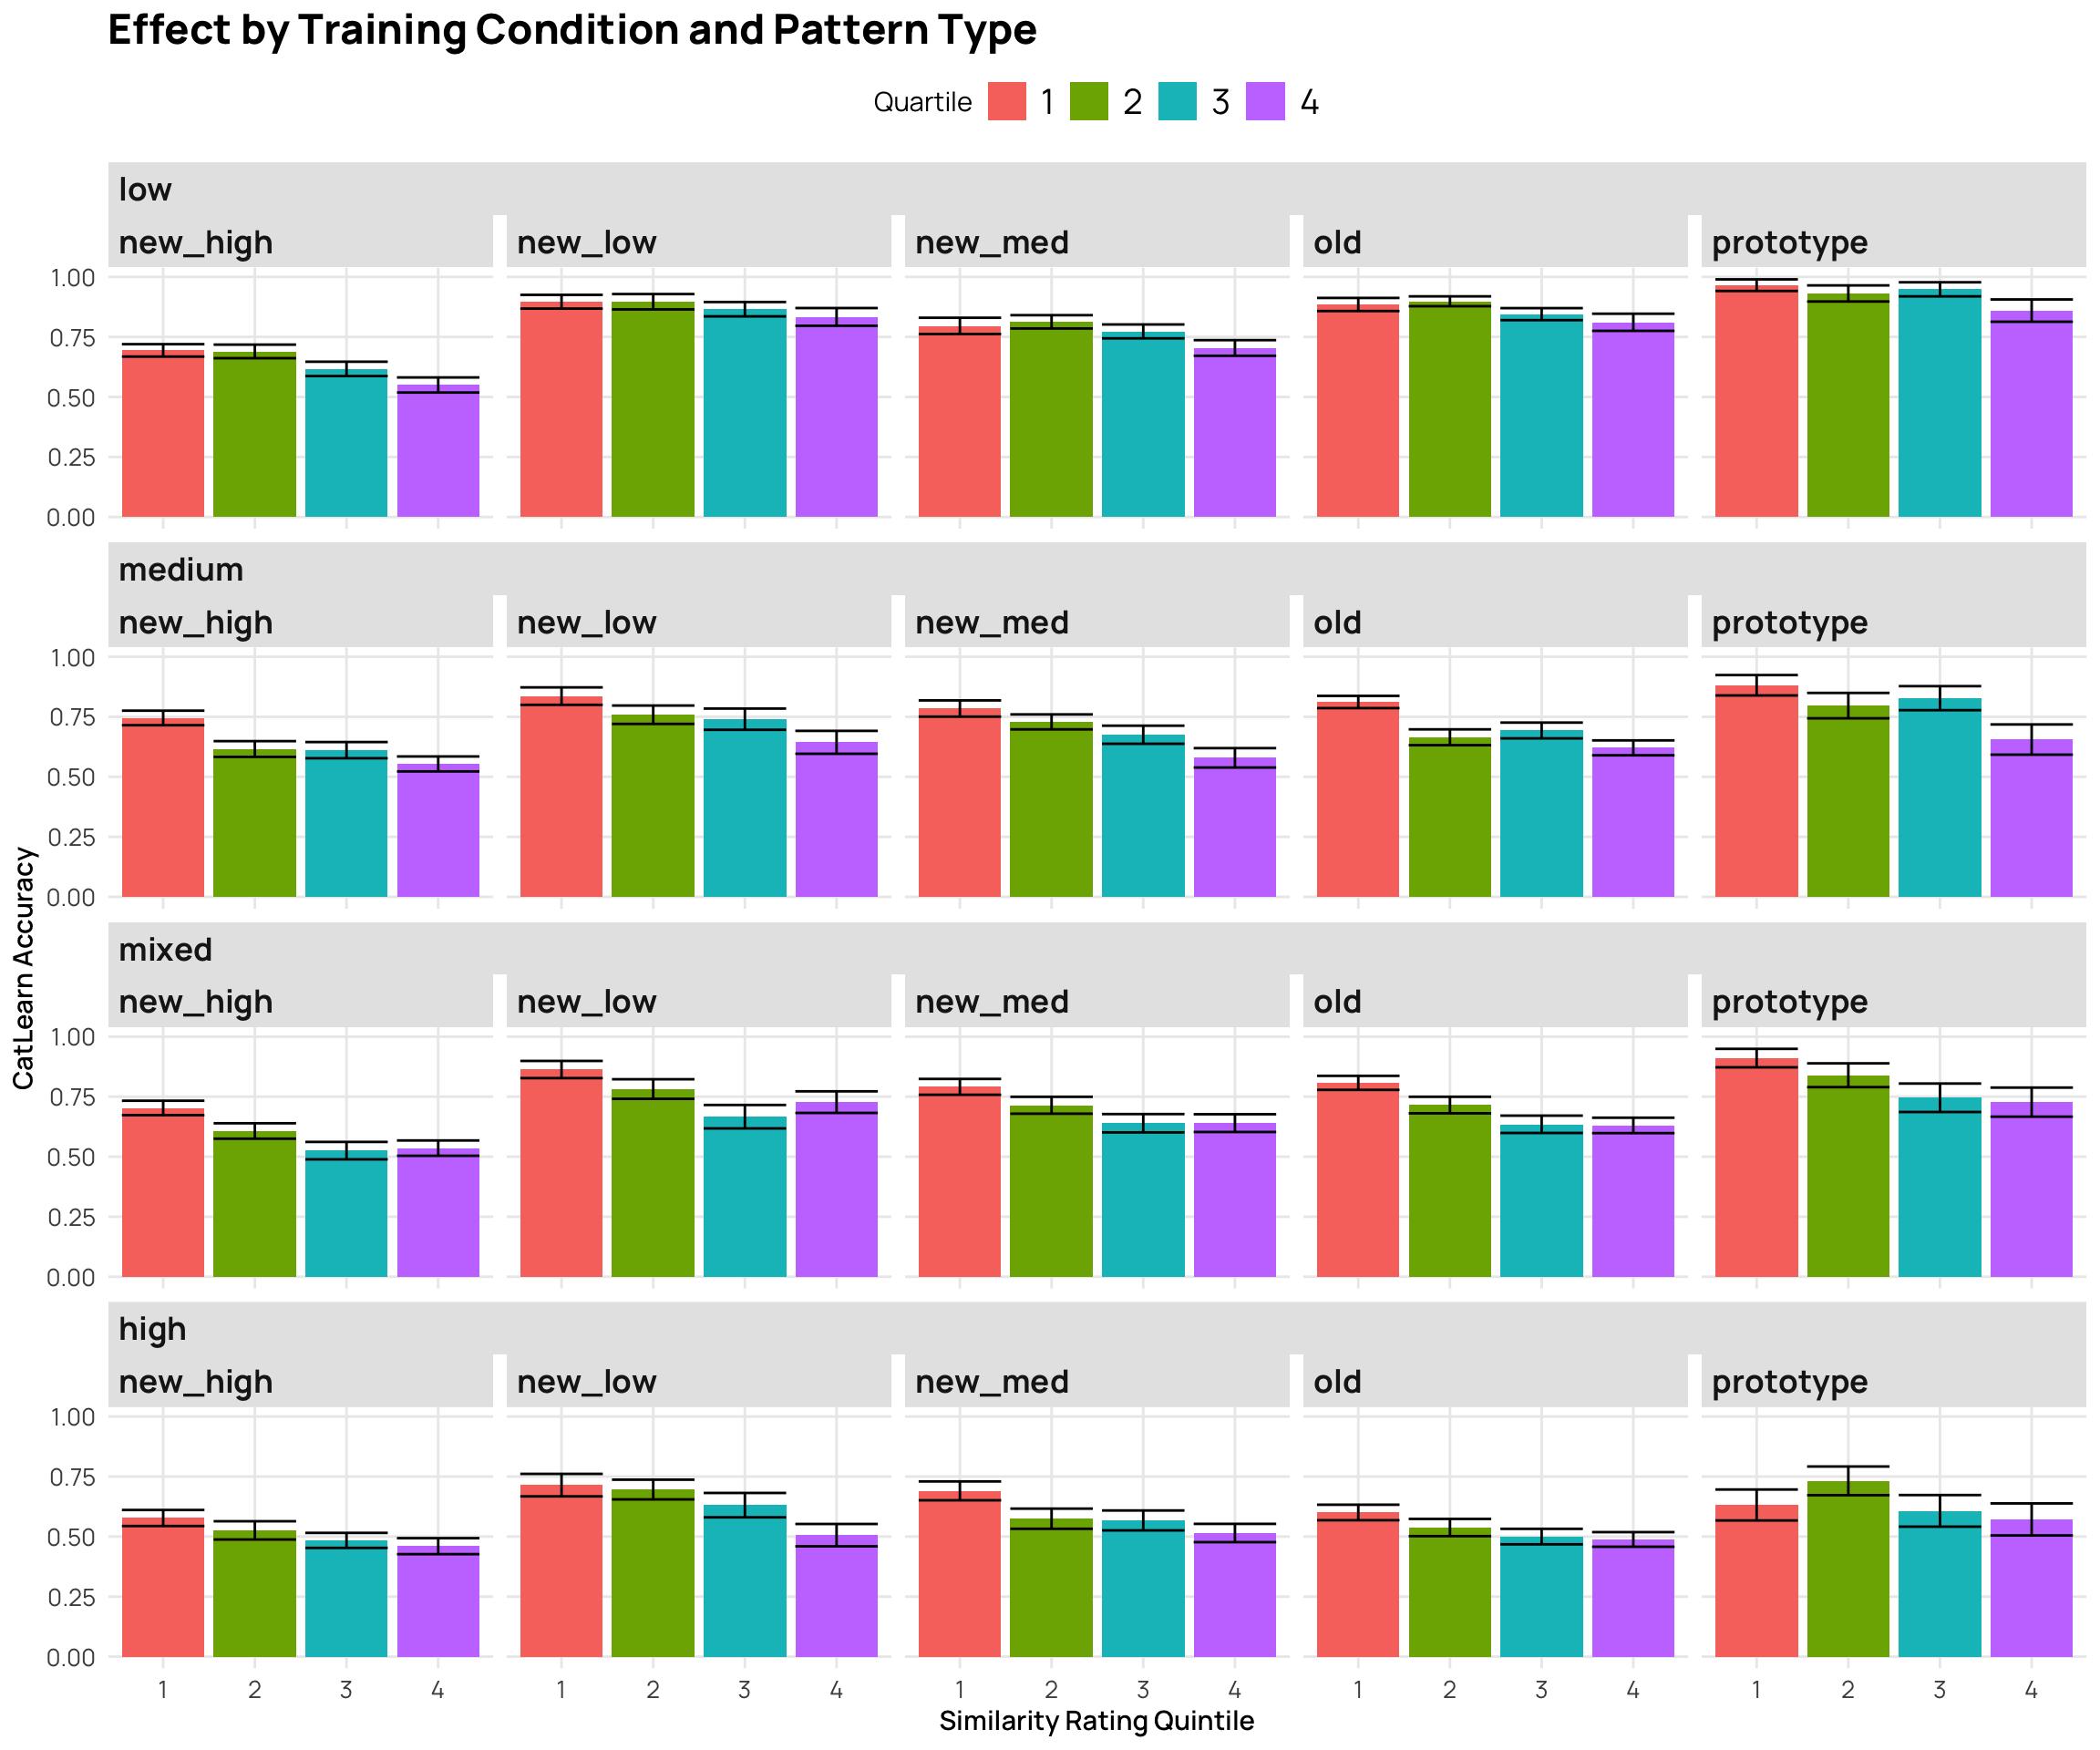
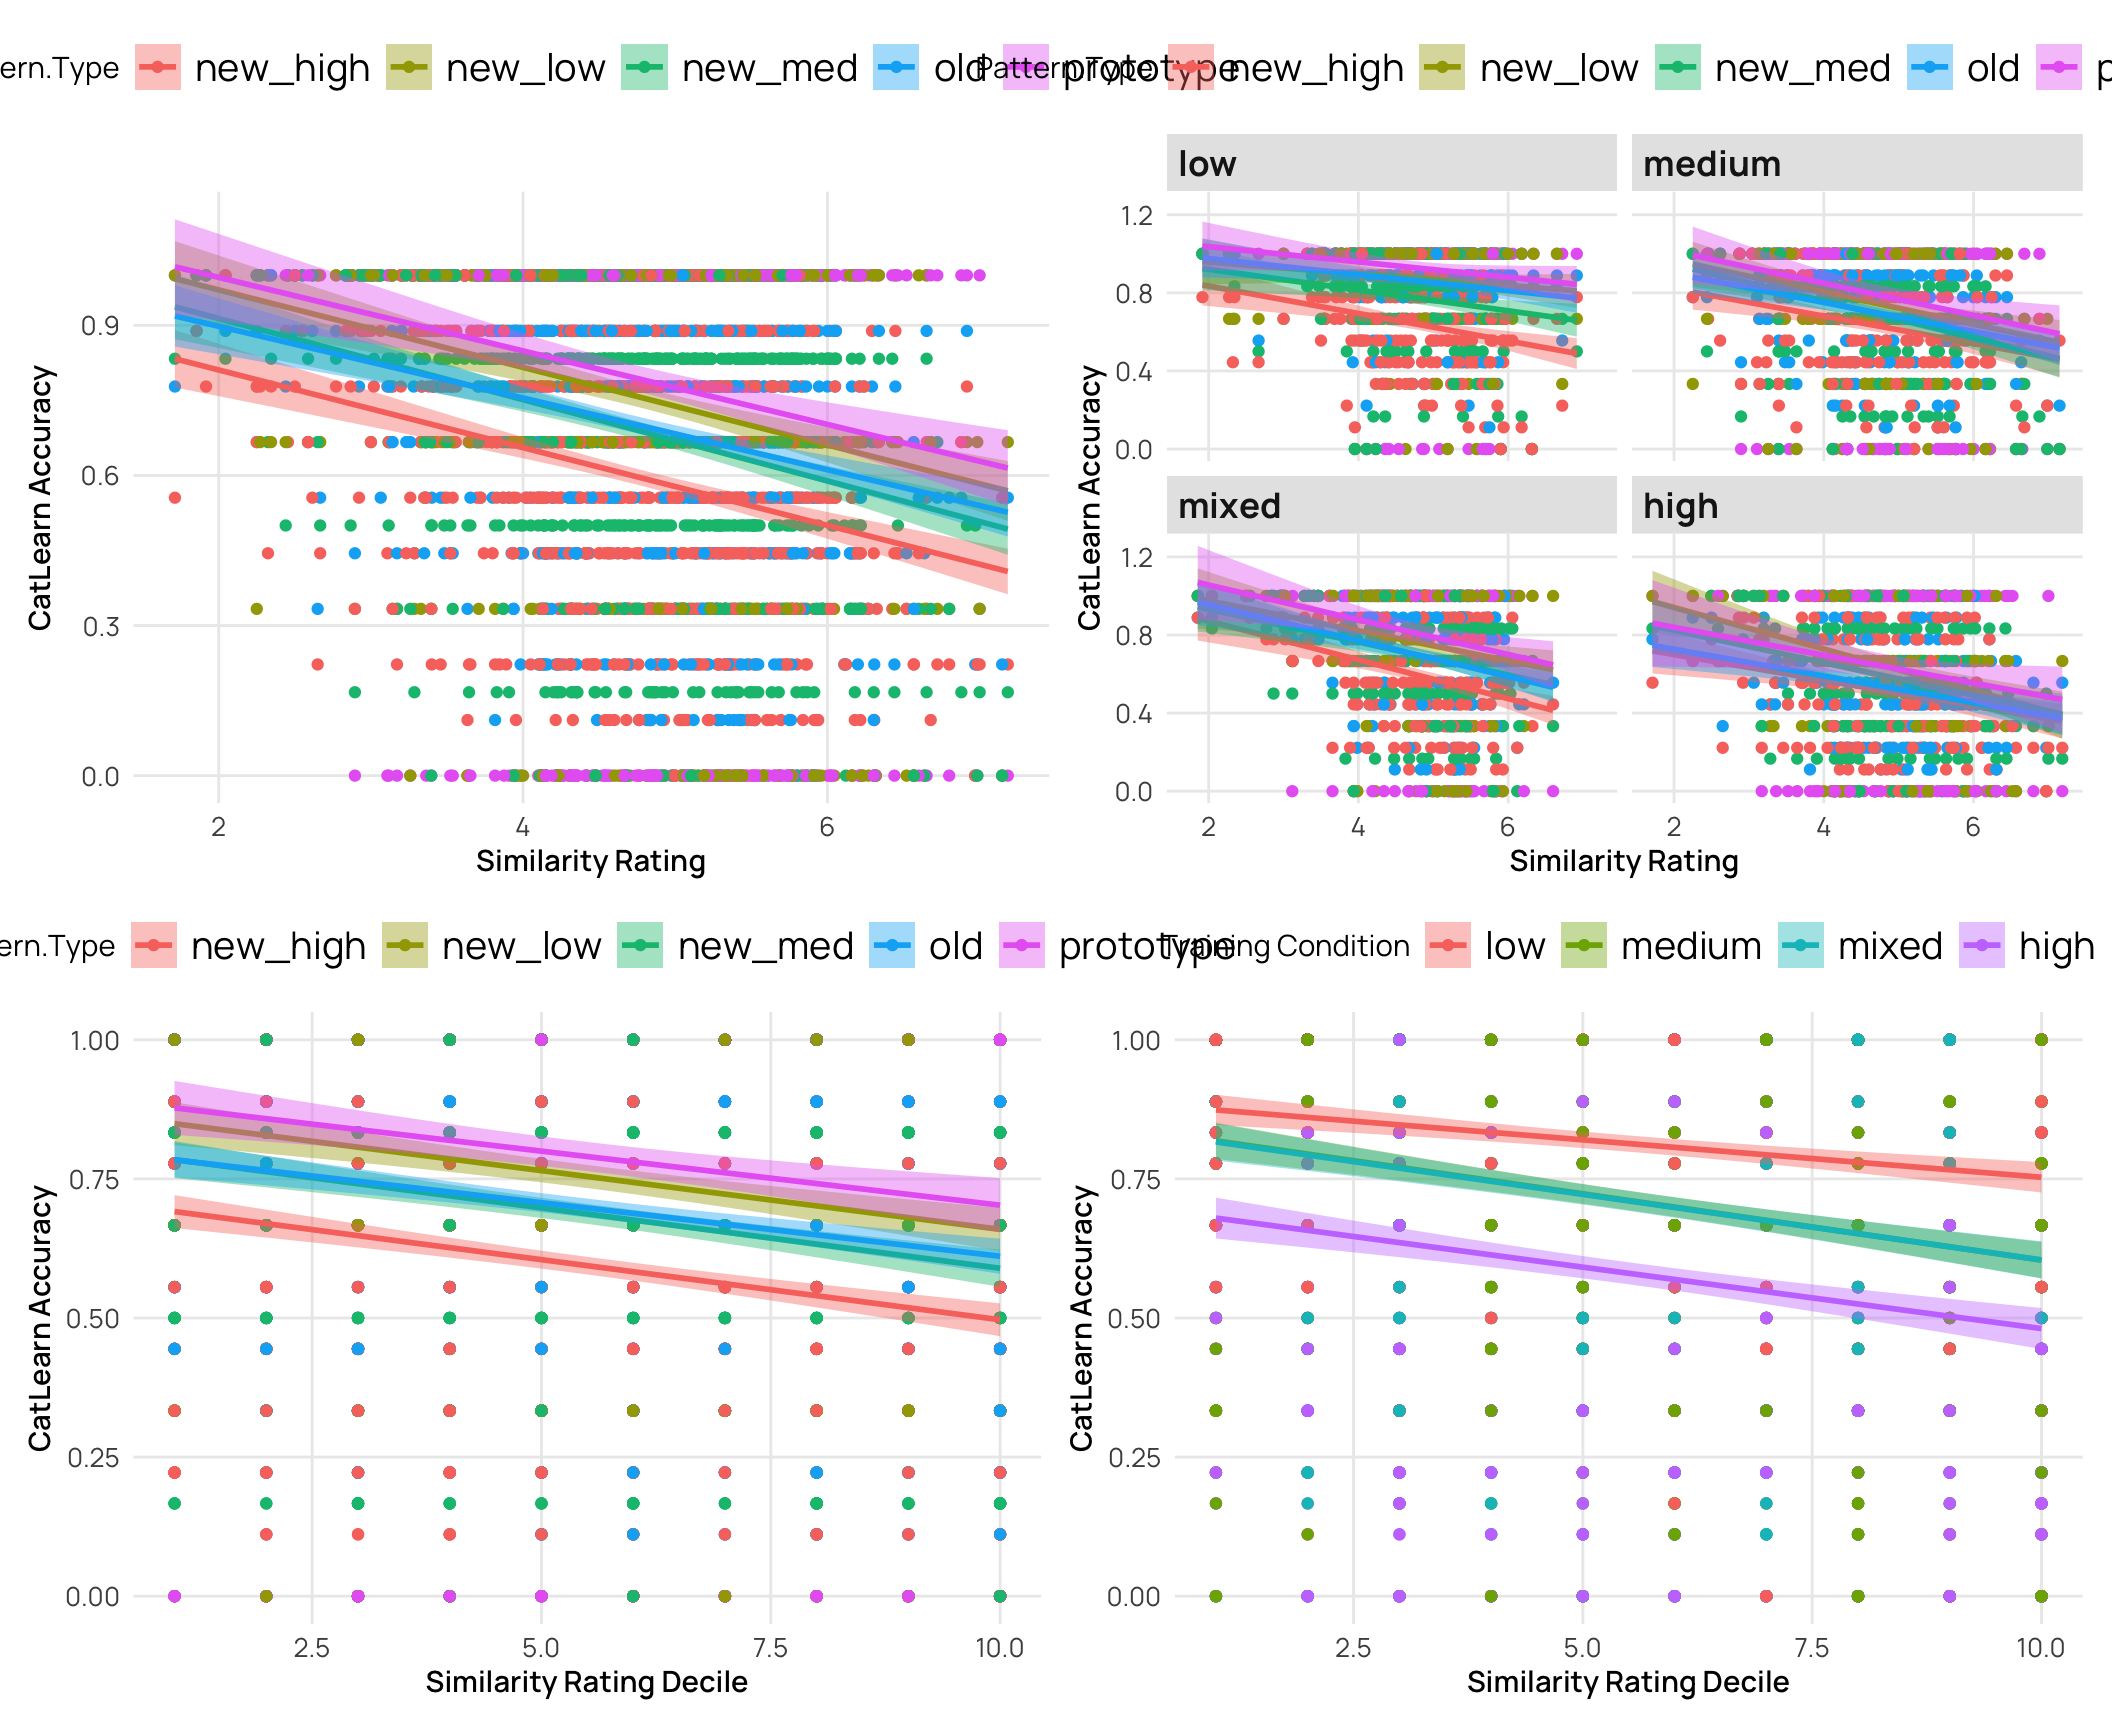
- generally a negative correlation - higher simimlarity rating -> lower accuracy
- quartiles and deciles are roughly evenly grouped bins, while the extreme similarity grouping has the bulk of the ratings in the medium group
#### Quartiles and Deciles
```{r}
#| label: fig-sim-acc-test
#| fig-cap: "2024 CatLearn accuracy by different similarity rating groups"
#| fig-width: 12
#| fig-height: 10
p3 <- cat_sim_test |>
  mutate(Quartile = as.factor(ntile(resp, 4))) |>
  ggplot(aes(x=Quartile,y=Corr,fill=Quartile)) +
  stat_bar +
  facet_wrap(~Pattern.Type) +
  labs(y="CatLearn Accuracy", x="Similarity Rating Quartile", title="Effect by Pattern Type",fill="Similarity Rating Quartile")


p4 <- cat_sim_test |>
  mutate(Decile = as.factor(ntile(resp, 10))) |>
  ggplot(aes(x=Decile,y=Corr,fill=Decile)) +
  stat_bar +
  facet_wrap(~Pattern.Type) +
  labs(y="CatLearn Accuracy", x="Similarity Rating Decile", title="Effect by Pattern Type", fill="Similarity Rating Decile")

p5 <- cat_sim_test |>
  mutate(Quartile = as.factor(ntile(resp, 4))) |>
  ggplot(aes(x=Quartile,y=Corr,fill=Quartile)) +
  stat_bar +
  facet_wrap(~condit) + labs(y="CatLearn Accuracy", x="Similarity Rating Quartile", title="Effect by Training Condition", fill="Similarity Rating Quartile")


p6 <- cat_sim_test |>
  mutate(Decile = as.factor(ntile(resp, 10))) |>
  ggplot(aes(x=Decile,y=Corr,fill=Decile)) +
  stat_bar +
  facet_wrap(~condit) + labs(y="CatLearn Accuracy", x="Similarity Rating Decile", title="Effect by Training Condition", fill="Similarity Rating Decile")


p7 <- cat_sim_test |>
  mutate(Quartile = as.factor(ntile(resp, 4))) |>
  ggplot(aes(x=Quartile,y=Corr,fill=Quartile)) +
  stat_bar +
  facet_nested_wrap(~condit+Pattern.Type) + labs(y="CatLearn Accuracy", x="Similarity Rating Quintile", title="Effect by Training Condition and Pattern Type")

p3 + p4
p5 + p6
p7


###
```
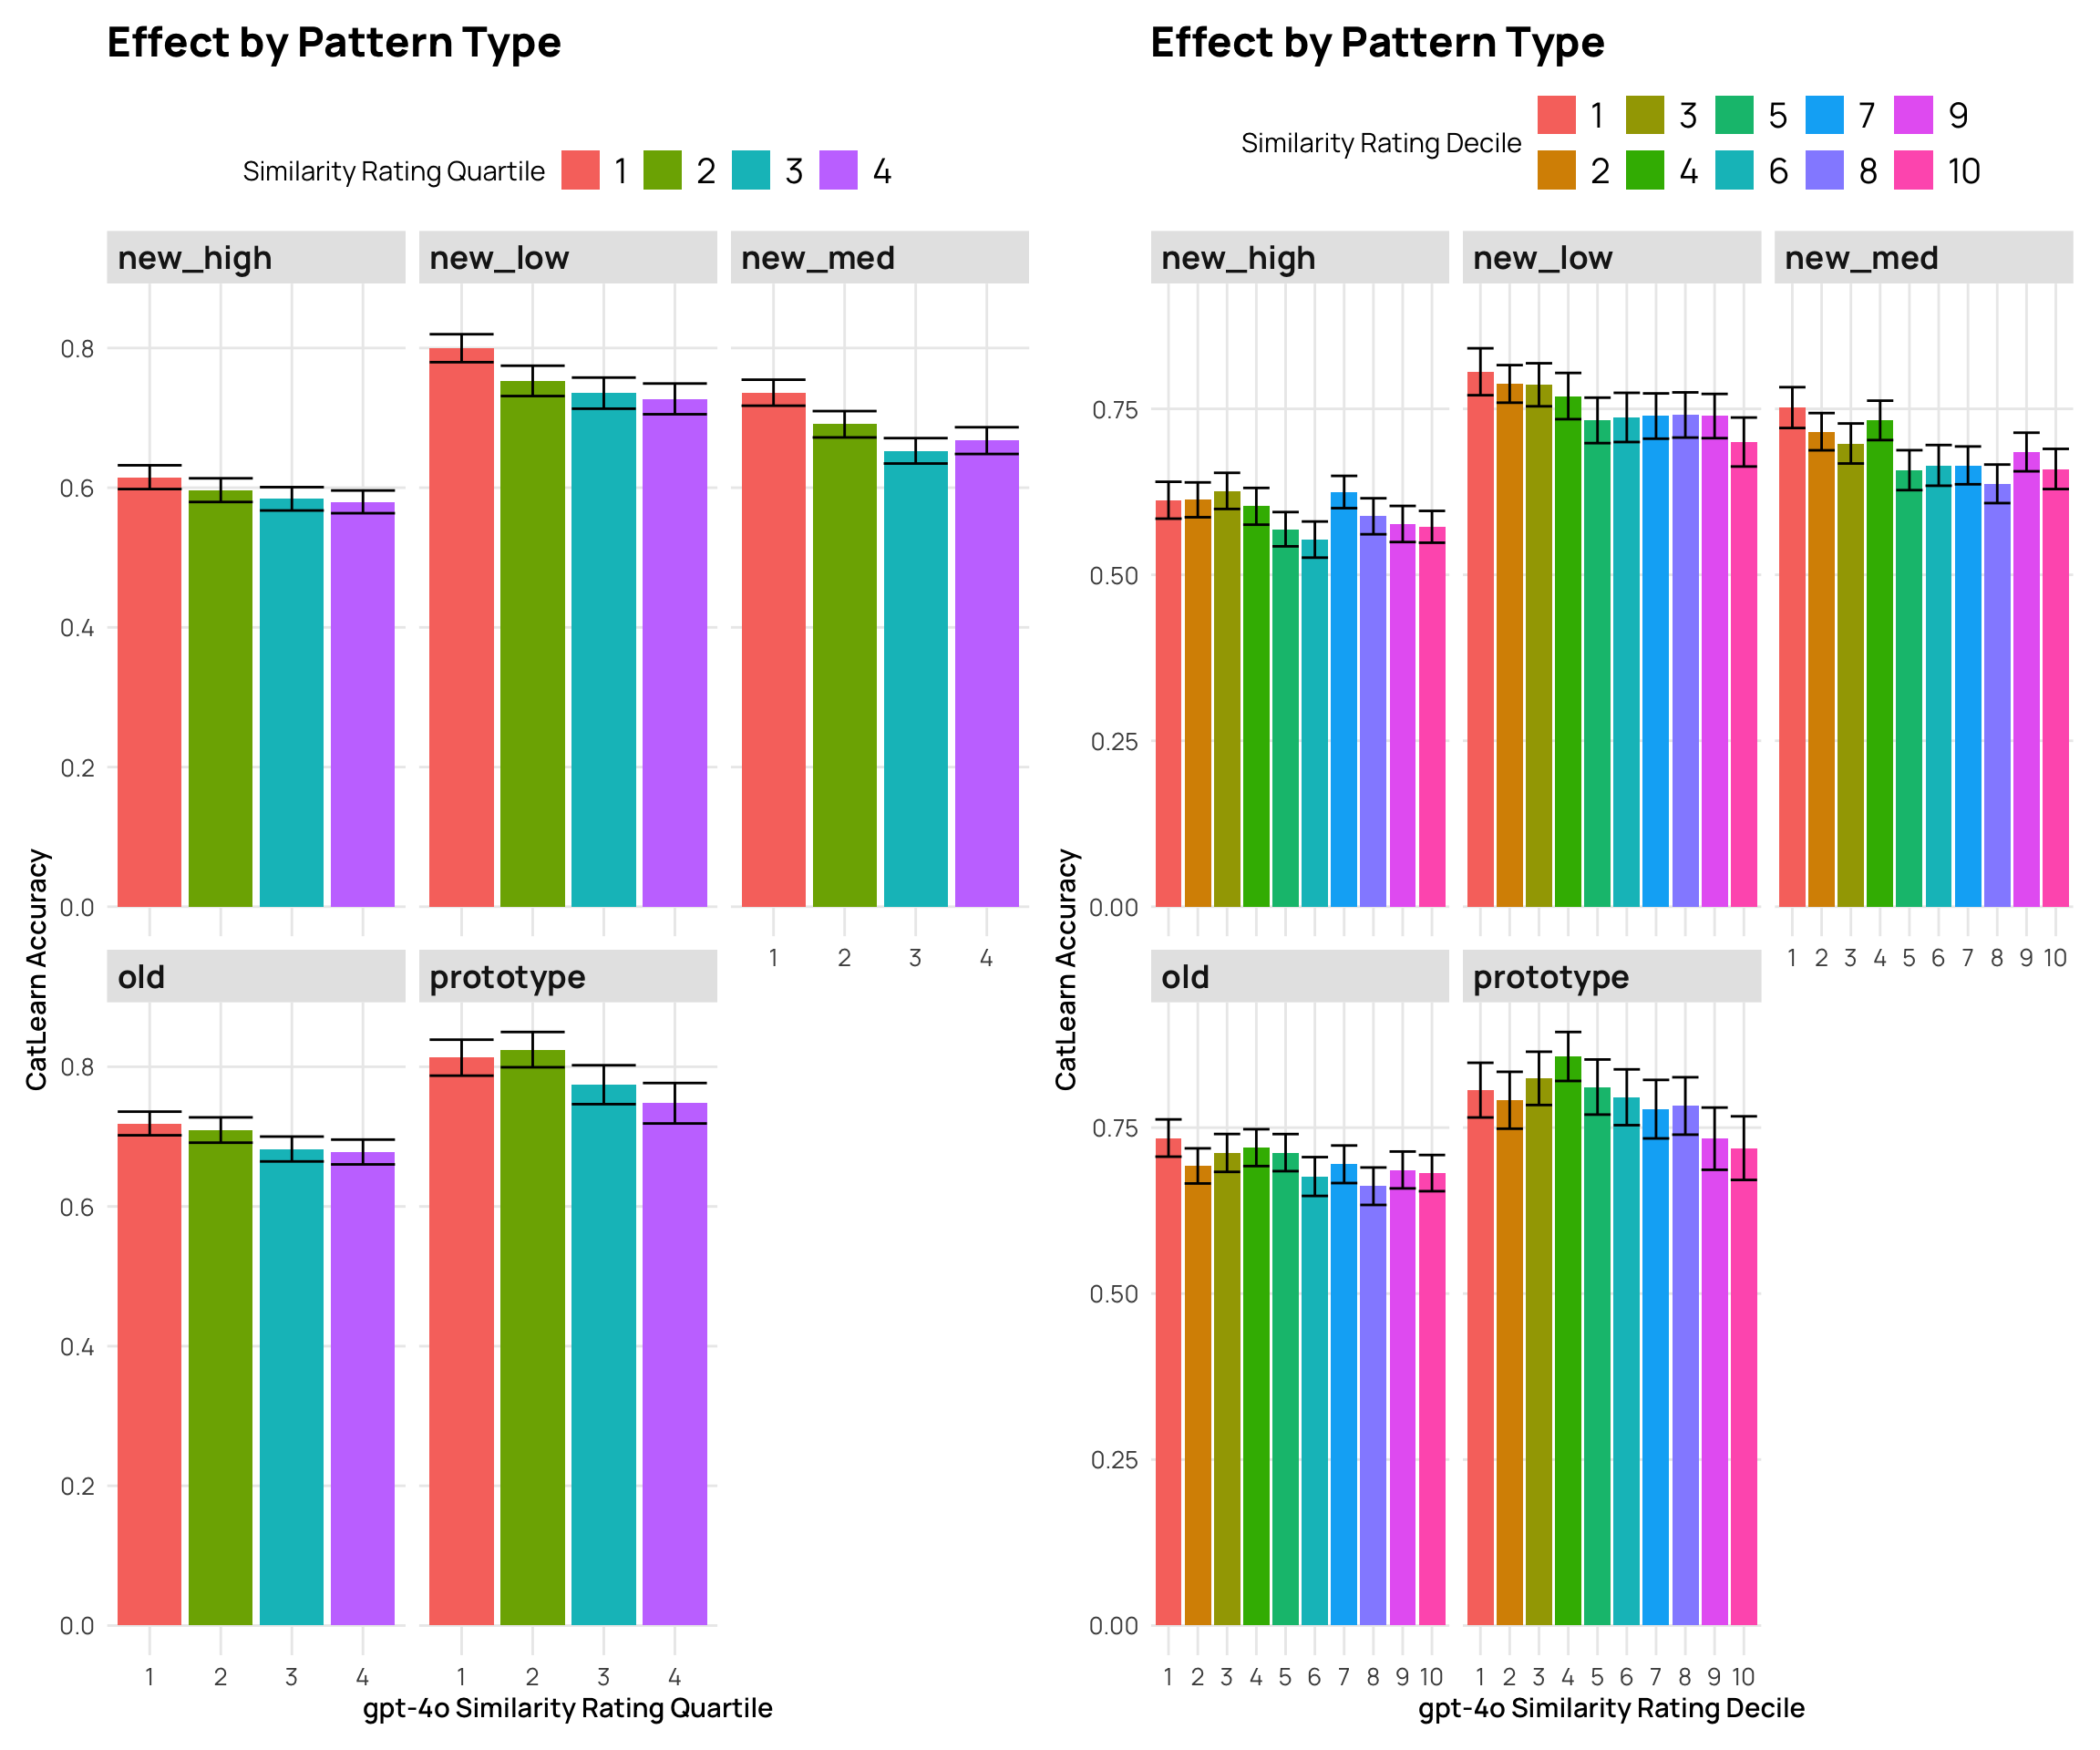
### gpt-4o predicted similarities
```{r}
#| label: fig-sim-acc-test-gpt
#| fig-cap: "2024 CatLearn accuracy by different gpt4-o similarity rating groups"
#| fig-width: 12
#| fig-height: 10
cat_sim_gpt <- sbj_cat |>
  mutate(item=item_label) |>
  left_join(patternAvg,by=c("file","item"))  |> arrange(desc(n_rating)) |>
  filter(!is.na(n_rating),n_rating>=12) |>
  mutate(sim_group = ifelse(gpt_sim>5.5,"Very Similar",ifelse(gpt_sim<3.9,"Very Dissimilar","Medium"))) |>
  mutate(sim_group=factor(sim_group,levels=c("Very Dissimilar","Medium","Very Similar"))) |>
  filter(!is.na(gpt_sim))

cat_sim_test_gpt <- cat_sim_gpt |>
  filter(Phase==2) |>
  mutate(rate_quartile = as.factor(ntile(gpt_sim, 4))) |>
  group_by(id,condit) |>
  mutate(agg_corr=mean(Corr)) |>
  group_by(condit) |>
  mutate(quartile=ntile(agg_corr,4),ms=ntile(agg_corr,2))


p3 <- cat_sim_test_gpt |>
  mutate(Quartile = as.factor(ntile(gpt_sim, 4))) |>
  ggplot(aes(x=Quartile,y=Corr,fill=Quartile)) +
  stat_bar +
  facet_wrap(~Pattern.Type) +
  labs(y="CatLearn Accuracy", x="gpt-4o Similarity Rating Quartile", title="Effect by Pattern Type",fill="Similarity Rating Quartile")


p4 <- cat_sim_test_gpt |>
  mutate(Decile = as.factor(ntile(gpt_sim, 10))) |>
  ggplot(aes(x=Decile,y=Corr,fill=Decile)) +
  stat_bar +
  facet_wrap(~Pattern.Type) +
  labs(y="CatLearn Accuracy", x="gpt-4o Similarity Rating Decile", title="Effect by Pattern Type", fill="Similarity Rating Decile")


p5 <- cat_sim_test_gpt |>
  mutate(Quartile = as.factor(ntile(gpt_sim, 4))) |>
  ggplot(aes(x=Quartile,y=Corr,fill=Quartile)) +
  stat_bar +
  facet_wrap(~condit) + labs(y="CatLearn Accuracy", x="gpt-4o Similarity Rating Quartile", title="Effect by Training Condition", fill="Similarity Rating Quartile")


p6 <- cat_sim_test_gpt |>
  mutate(Decile = as.factor(ntile(gpt_sim, 10))) |>
  ggplot(aes(x=Decile,y=Corr,fill=Decile)) +
  stat_bar +
  facet_wrap(~condit) + labs(y="CatLearn Accuracy", x="gpt-4o Similarity Rating Decile", title="Effect by Training Condition", fill="Similarity Rating Decile")

p7 <- cat_sim_test_gpt |>
  mutate(Quartile = as.factor(ntile(gpt_sim, 4))) |>
  ggplot(aes(x=Quartile,y=Corr,fill=Quartile)) +
  stat_bar +
  facet_nested_wrap(~condit+Pattern.Type) + labs(y="CatLearn Accuracy", x="gpt-4o Similarity Rating Quintile", title="Effect by Training Condition and Pattern Type")


p3 + p4
p5 + p6
p7


# cat_sim_test_gpt |>
#   group_by(sbjCode,condit,quartile,rate_quartile) |>
#   summarize(resp=mean(gpt_sim),corr=mean(Corr)) |>
#   mutate(quartile=factor(quartile,levels=c(1,2,3,4))) |>
#   ggplot(aes(x=rate_quartile,y=corr,fill=rate_quartile)) +
#   stat_bar +
#   labs(y="CatLearn Accuracy",x="Training Condition")


p8 <- cat_sim_test_gpt |>
  group_by(sbjCode,condit,quartile,rate_quartile) |>
  summarize(resp=mean(gpt_sim),corr=mean(Corr)) |>
  mutate(quartile=factor(quartile,levels=c(1,2,3,4))) |>
  ggplot(aes(x=condit,y=corr,fill=rate_quartile)) +
  stat_bar +
 # geom_boxplot() +
#   facet_wrap(~condit) +
  labs(y="CatLearn Accuracy",x="Training Condition")


p9 <- cat_sim_test_gpt |>
  group_by(sbjCode,condit,ms,sim_group) |>
  summarize(resp=mean(gpt_sim),corr=mean(Corr)) |>
  mutate(ms=factor(ms,levels=c(1,2))) |>
  ggplot(aes(x=condit,y=corr,fill=sim_group)) +
  stat_bar +
  facet_wrap(~ms) +
  labs(y="CatLearn Accuracy",x="Training Condition")

p8 + p9
```
<br><br>
#### Quartiles and Deciles - using maximum similarity
```{r}
#| label: fig-sim-acc-test-max
#| fig-cap: "2024 CatLearn accuracy by different similarity rating groups"
#| fig-width: 12
#| fig-height: 10
p3 <- cat_sim_test2 |>
  mutate(Quartile = as.factor(ntile(max_sim, 4))) |>
  ggplot(aes(x=Quartile,y=Corr,fill=Quartile)) +
  stat_bar +
  facet_wrap(~Pattern.Type) +
  labs(y="CatLearn Accuracy", x="Similarity Rating Quartile", title="Effect by Pattern Type",fill="Similarity Rating Quartile")


p4 <- cat_sim_test2 |>
  mutate(Decile = as.factor(ntile(max_sim, 10))) |>
  ggplot(aes(x=Decile,y=Corr,fill=Decile)) +
  stat_bar +
  facet_wrap(~Pattern.Type) +
  labs(y="CatLearn Accuracy", x="Similarity Rating Decile", title="Effect by Pattern Type", fill="Similarity Rating Decile")

p5 <- cat_sim_test2 |>
  mutate(Quartile = as.factor(ntile(max_sim, 4))) |>
  ggplot(aes(x=Quartile,y=Corr,fill=Quartile)) +
  stat_bar +
  facet_wrap(~condit) + labs(y="CatLearn Accuracy", x="Similarity Rating Quartile", title="Effect by Training Condition", fill="Similarity Rating Quartile")


p6 <- cat_sim_test2 |>
  mutate(Decile = as.factor(ntile(max_sim, 10))) |>
  ggplot(aes(x=Decile,y=Corr,fill=Decile)) +
  stat_bar +
  facet_wrap(~condit) + labs(y="CatLearn Accuracy", x="Similarity Rating Decile", title="Effect by Training Condition", fill="Similarity Rating Decile")


p7 <- cat_sim_test2 |>
  mutate(Quartile = as.factor(ntile(max_sim, 4))) |>
  ggplot(aes(x=Quartile,y=Corr,fill=Quartile)) +
  stat_bar +
  facet_nested_wrap(~condit+Pattern.Type) + labs(y="CatLearn Accuracy", x="Similarity Rating Quintile", title="Effect by Training Condition and Pattern Type")

p3 + p4
p5 + p6
p7
```
#### Extreme similarity rating groups
```{r}
#| label: fig-sim-acc-test2
#| fig-cap: "2024 CatLearn accuracy by different similarity rating groups"
#| fig-width: 13
#| fig-height: 15
p9 <- cat_sim_test |>
  ggplot(aes(y=Corr,x=Pattern.Type, fill=sim_group)) +
  stat_bar + labs(title="Group by Pattern Type",y="CatLearn Accuracy", fill="Similarity Rating Group")

p10 <- cat_sim_test |>
  ggplot(aes(y=Corr,x=condit, fill=sim_group)) +
  stat_bar + labs(title="Group by Condit",y="CatLearn Accuracy", fill="Similarity Rating Group")

p11 <- cat_sim_test |>
  ggplot(aes(y=Corr,x=sim_group, fill=sim_group)) +
  stat_bar +
  facet_nested_wrap(~condit+Pattern.Type) +
  labs(title="Separate by Condit and Pattern Type",y="CatLearn Accuracy", fill="Similarity Rating Group") +
  theme(axis.text.x = element_text(size=5,angle = 45, hjust = 0.5, vjust = 0.5))


 (p9 / p10)/p11 + plot_annotation(title="CatLearn accuracy by extreme similarity rating groups") +
  plot_layout(heights = c(1,1,2))
```
::: {.panel-tabset}
### learning curves
```{r}
#| label: fig-train-sim
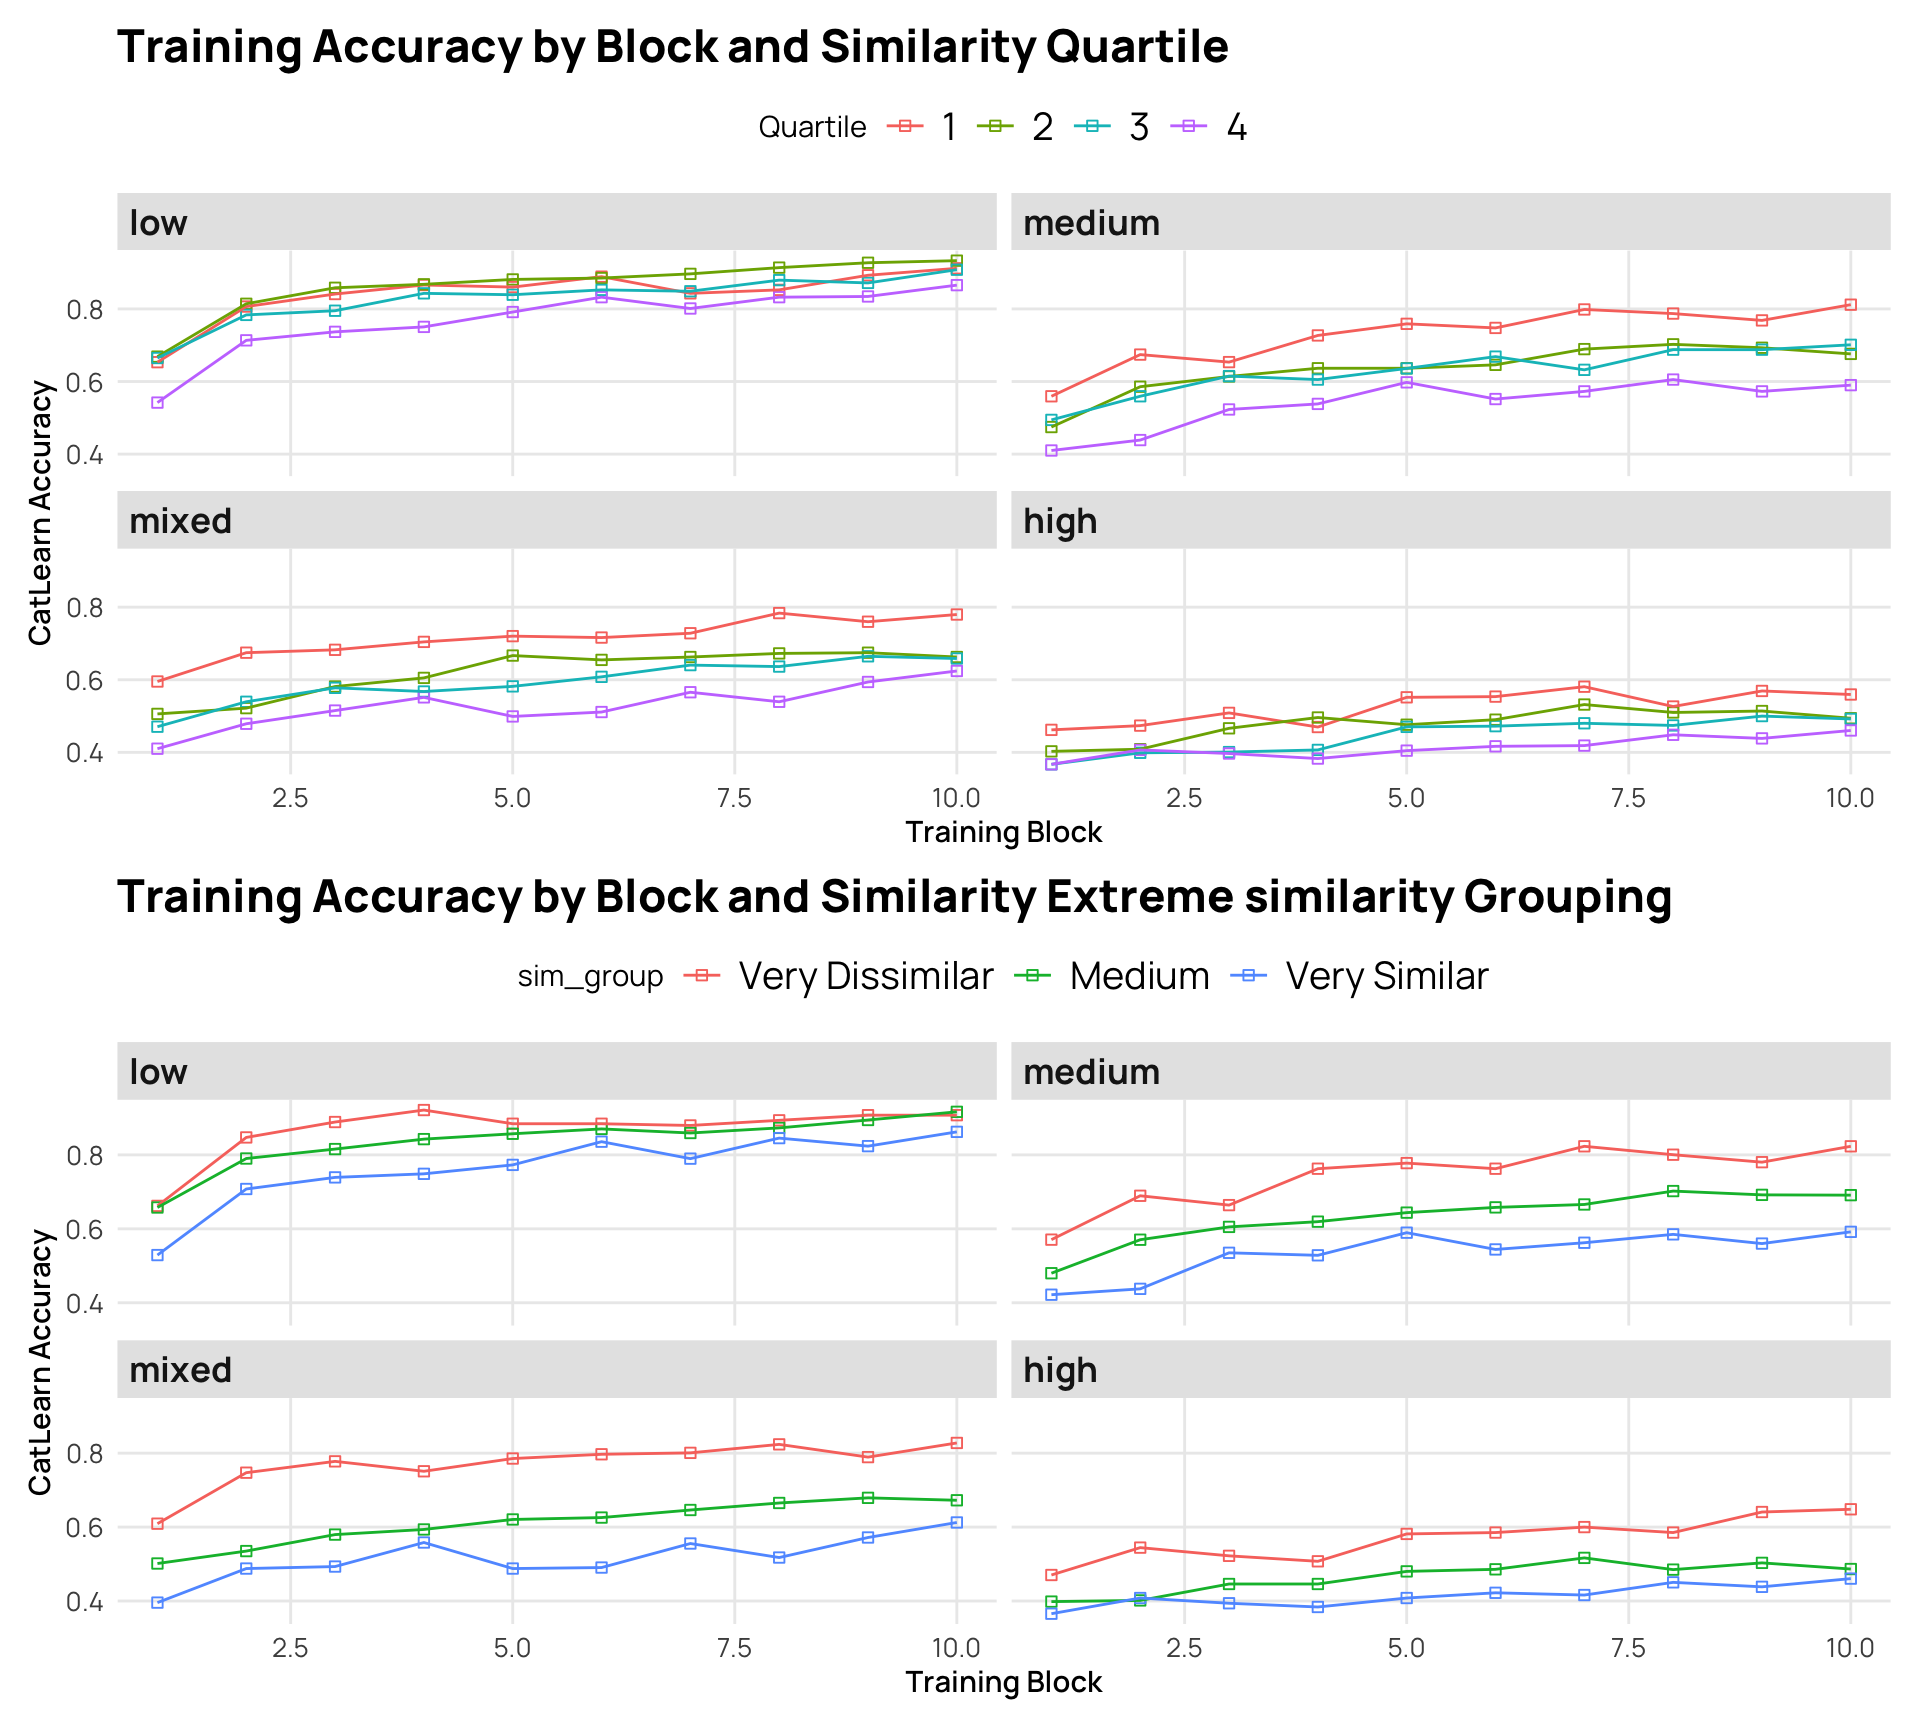
#| fig-cap: "Training accuracy by block and similarity rating"
#| fig-width: 10
#| fig-height: 9
# trSim1 <- cat_sim |> filter(Phase==1) |>
#   group_by(condit,Block) |>
#   mutate(Quartile = as.factor(ntile(resp, 4))) |>
#   ggplot(aes(x=Block,y=Corr, fill=Quartile)) + stat_bar+  facet_wrap(~condit)  +
#    labs(x="Training Block", y="CatLearn Accuracy",fill="Similarity Rating Quartile")


# trSim2 <- cat_sim |> filter(Phase==1) |>
#   group_by(condit,Block) |>
#   ggplot(aes(x=Block,y=Corr, fill=sim_group)) +
#    stat_bar+
#    facet_wrap(~condit) +
#   labs(x="Training Block", y="CatLearn Accuracy",fill="Similarity Rating Group")


trSim1 <- cat_sim |> filter(Phase==1) |>
  group_by(condit,Block) |>
  mutate(Quartile = as.factor(ntile(resp, 4))) |>
  ggplot(aes(x=Block,y=Corr, col=Quartile)) +
    stat_summary(shape=0,geom="point",fun="mean")+
  stat_summary(geom="line",fun="mean")+
   facet_wrap(~condit)  +
   labs(x="Training Block", y="CatLearn Accuracy",fill="Similarity Rating Quartile",title = "Training Accuracy by Block and Similarity Quartile")

trSim2 <- cat_sim |> filter(Phase==1) |>
  group_by(condit,Block) |>
  ggplot(aes(x=Block,y=Corr, col=sim_group)) +
      stat_summary(shape=0,geom="point",fun="mean")+
  stat_summary(geom="line",fun="mean")+
   facet_wrap(~condit) +
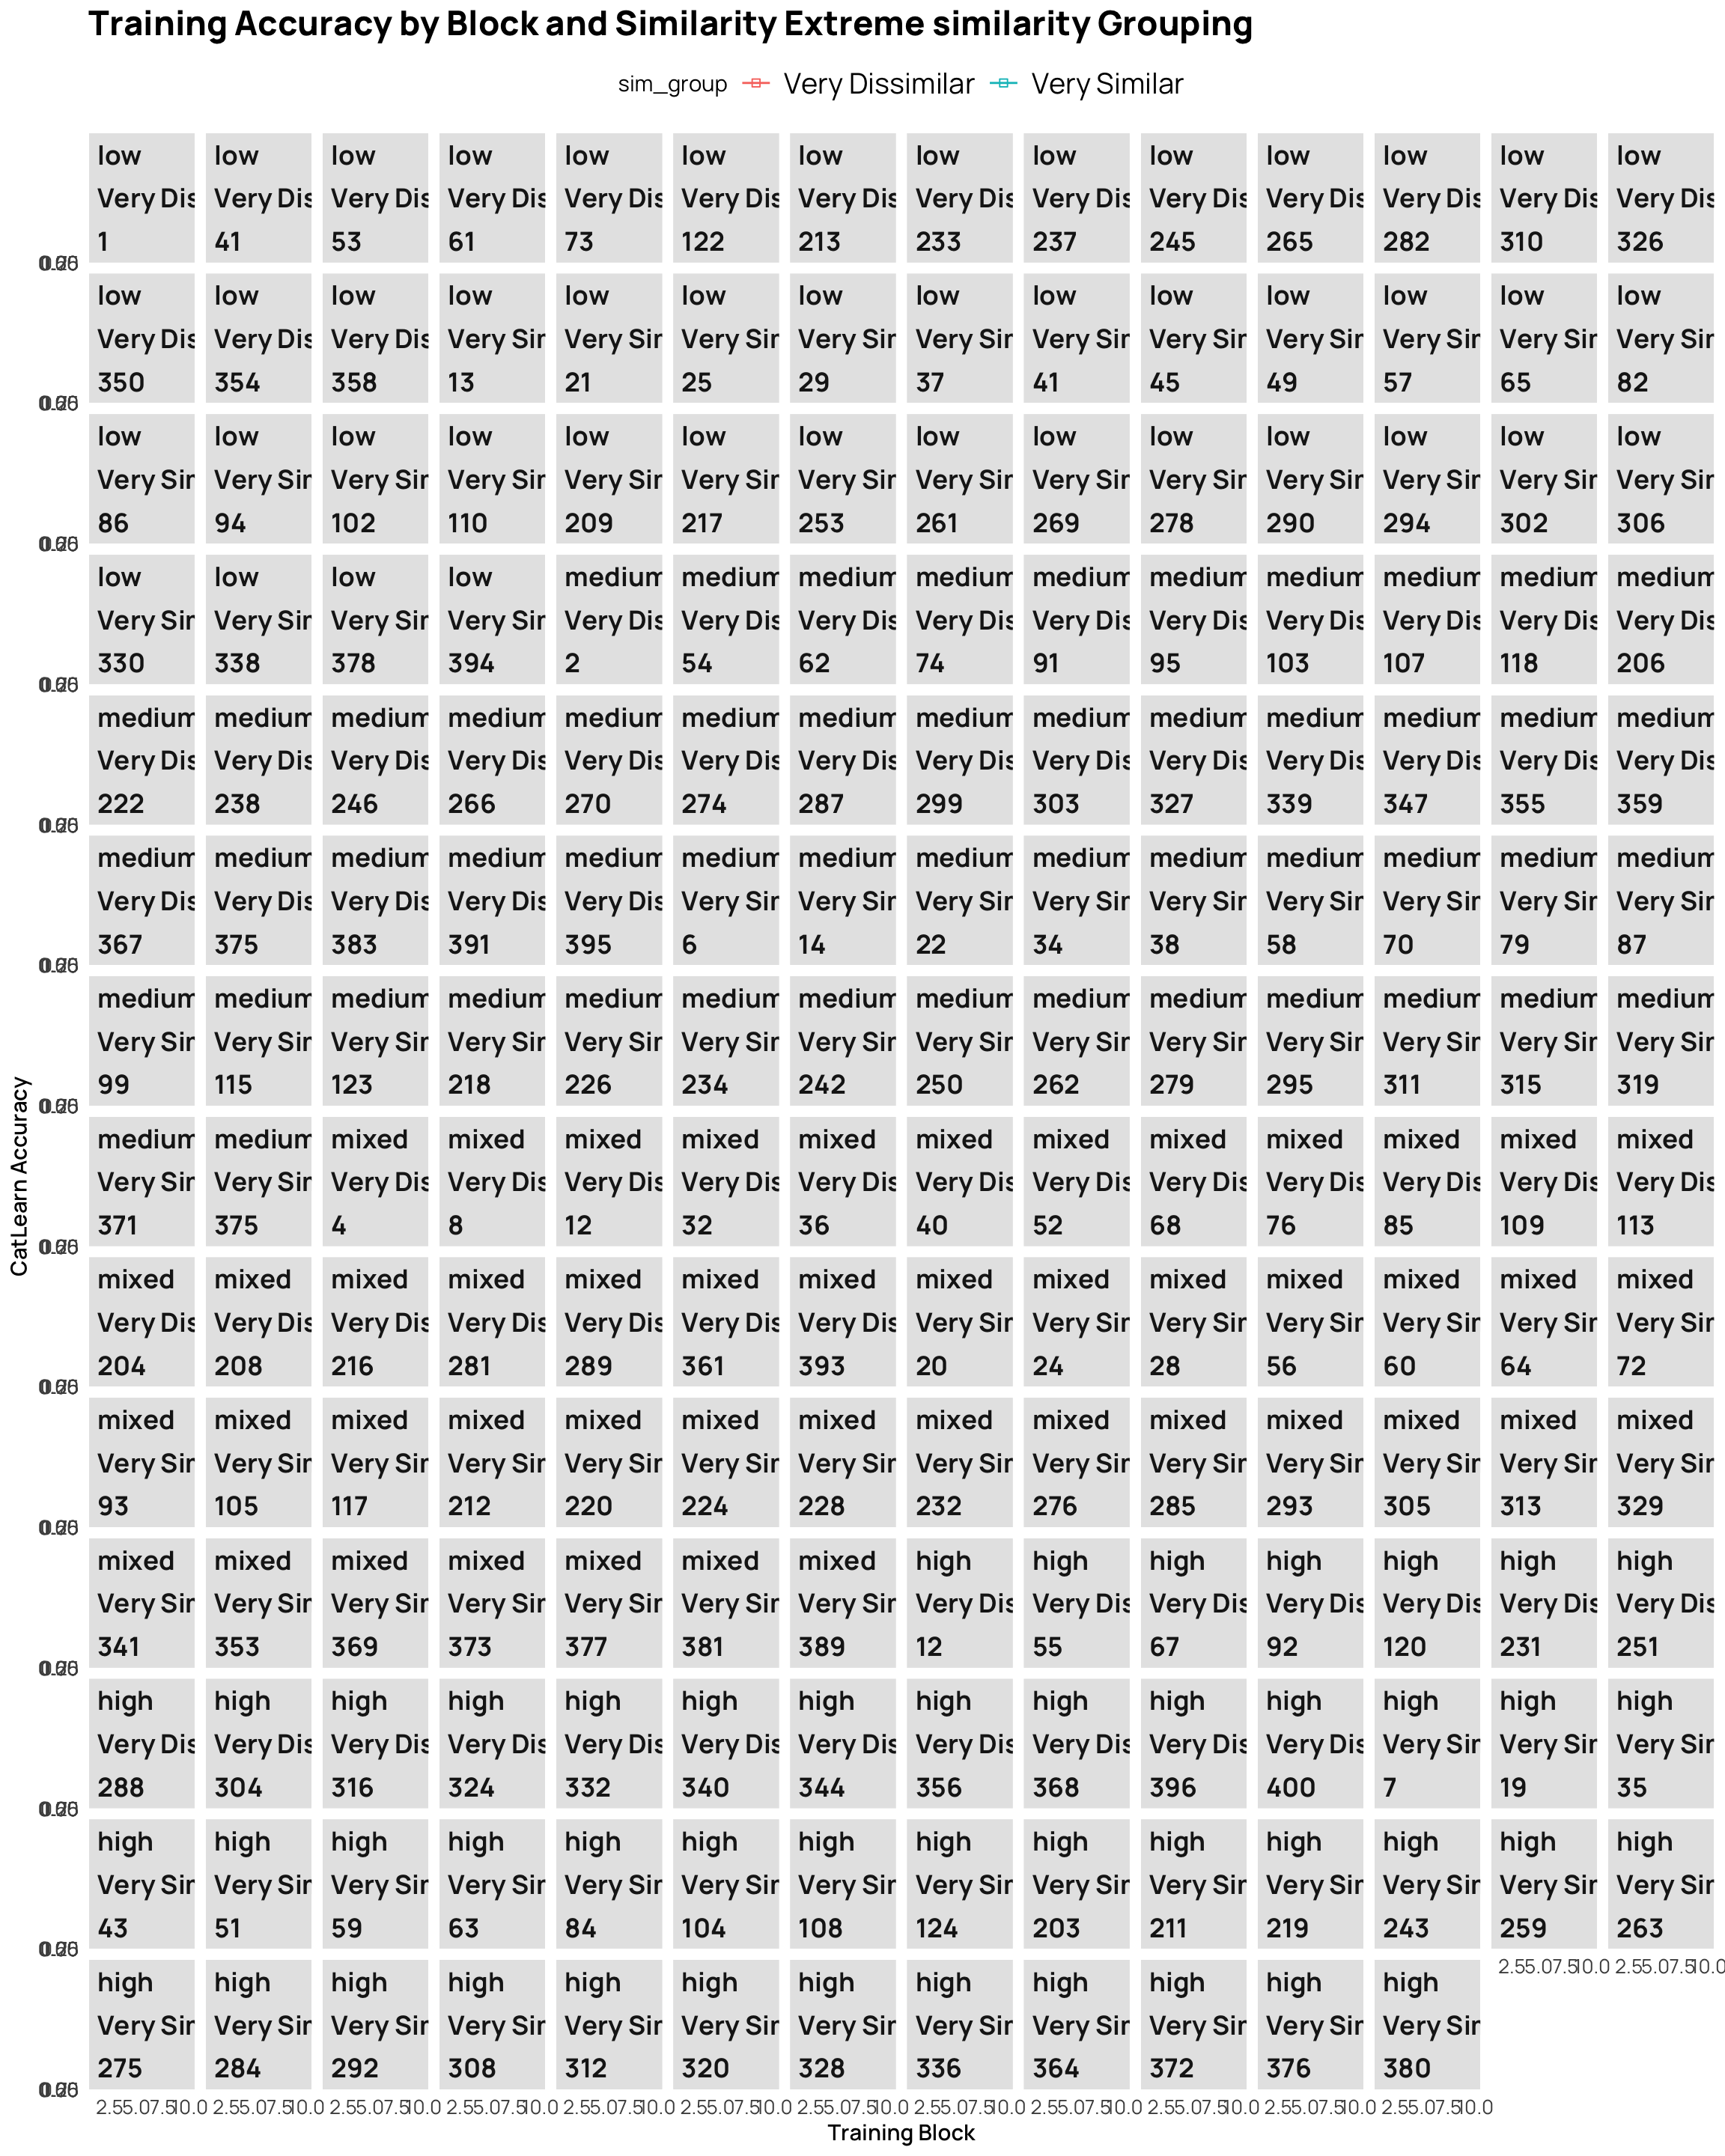
  labs(x="Training Block", y="CatLearn Accuracy",fill="Similarity Rating Group", title="Training Accuracy by Block and Similarity Extreme similarity Grouping")


trSim1/trSim2
```
### Individual Learning Curves
```{r}
#| label: fig-train-sim-indv
#| fig-cap: "Training accuracy by block and similarity rating"
#| fig-width: 12
#| fig-height: 15
 trIndv <- cat_sim |> filter(Phase==1, !(sim_group=="Medium")) |>
  group_by(condit,Block) |>
  mutate(Quartile = as.factor(ntile(resp, 4))) |>
  ggplot(aes(x=Block,y=Corr, col=sim_group)) +
      stat_summary(shape=0,geom="point",fun="mean")+
  stat_summary(geom="line",fun="mean")+
   facet_wrap2(~condit+sim_group+sbjCode) +
  labs(x="Training Block", y="CatLearn Accuracy",fill="Similarity Rating Group", title="Training Accuracy by Block and Similarity Extreme similarity Grouping")

trIndv

#cat_sim |> filter(Phase==1) |> group_by(id) |> summarize(n_sim = n_distinct(sim_group)) |> arrange(desc(n_sim)) |> head(10)

# cat_sim |> filter(Phase==1) |> group_by(id) |> mutate(n_sim = n_distinct(sim_group)) |> filter(n_sim>1)  |> group_by(condit,Block) |>
#   ggplot(aes(x=Block,y=Corr, col=sim_group)) +
#       stat_summary(shape=0,geom="point",fun="mean")+
#   stat_summary(geom="line",fun="mean")+
#    facet_wrap2(~condit+sbjCode)
```
:::
### Correlations between similarity ratings and CatLearn accuracy
```{r}
#| label: fig-sim-acc-corr
#| fig-cap: "Correlations between similarity ratings and CatLearn accuracy"
#| fig-width: 11
#| fig-height: 9
p1 <- cat_sim_test |> ggplot(aes(x=resp,y=Corr,col=Pattern.Type,fill=Pattern.Type)) +
  geom_point() +
  geom_smooth(method = "lm") +
 labs(y="CatLearn Accuracy", x="Similarity Rating")

p2 <- cat_sim_test |> ggplot(aes(x=resp,y=Corr, col=Pattern.Type,fill=Pattern.Type)) +
  geom_point() +
  geom_smooth(method = "lm") +
  facet_wrap(~condit) + labs(y="CatLearn Accuracy", x="Similarity Rating")


p3 <- cat_sim_test |>
mutate(Decile = ntile(resp, 10)) |>
ggplot(aes(x=Decile,y=Corr, col=Pattern.Type,fill=Pattern.Type)) +
  geom_point() +
  geom_smooth(method = "lm") +
 labs(y="CatLearn Accuracy", x="Similarity Rating Decile")


p4 <- cat_sim_test |>
mutate(Decile = ntile(resp, 10)) |>
ggplot(aes(x=Decile,y=Corr, col=condit,fill=condit)) +
  geom_point() +
  geom_smooth(method = "lm") +
 labs(y="CatLearn Accuracy", x="Similarity Rating Decile", fill="Training Condition", col="Training Condition")


(p1+p2) / (p3+p4)
```
```{r}
#cor(cat_sim$resp,cat_sim$Corr)

 m1 <- lmer(Corr ~ resp + (1|sbjCode), data=cat_sim)
 summary(m1)
  m1 <- lmer(Corr ~ resp + (1|sbjCode), data=cat_sim_test)
 summary(m1)
 m1 <- lmer(Corr ~ resp + (1|Pattern.Type) +  (1|sbjCode), data=cat_sim)
 summary(m1)
  m1 <- lmer(Corr ~ resp + (1|Pattern.Type) +  (1|sbjCode), data=cat_sim_test)
 summary(m1)
 m1 <- lmer(Corr ~ resp*condit +  (1|sbjCode) + (1+condit|Pattern.Type), data=cat_sim)
 summary(m1)
####


m1 <- lmer(Corr ~ gpt_sim + (1|sbjCode), data=cat_sim)
 summary(m1)
m1 <- lmer(Corr ~ gpt_sim + (1|sbjCode), data=cat_sim_test)
 summary(m1)
m1 <- lmer(Corr ~ gpt_sim + (1|Pattern.Type) +  (1|sbjCode), data=cat_sim_test)
 summary(m1)
m1 <- lmer(Corr ~ gpt_sim+resp + (1|sbjCode), data=cat_sim)
 summary(m1)
m1 <- lmer(Corr ~ gpt_sim + resp + (1|Pattern.Type) +  (1|sbjCode), data=cat_sim_test)
 summary(m1)
####
m1 <- lmer(Corr ~ max_sim + (1|sbjCode), data=max_sim)
 summary(m1)
m1 <- lmer(Corr ~ min_sim + (1|sbjCode), data=max_sim)
 summary(m1)
m1 <- lmer(Corr ~ min_sim*max_sim + (1|sbjCode), data=max_sim)
 summary(m1)
m1 <- lmer(Corr ~ max_sim + (1|Pattern.Type) +  (1|sbjCode), data=max_sim)
 summary(m1)
m1 <- lmer(Corr ~ max_sim*condit +  (1|sbjCode) + (1+condit|Pattern.Type), data=max_sim)
 summary(m1)
# m1 <- lmer(Corr ~ sim_group +  (1|sbjCode), data=cat_sim)
# summary(m1)

# m1 <- lmer(Corr ~ sim_group*condit +  (1|sbjCode), data=cat_sim)
# summary(m1)

# m1 <- lmer(Corr ~ sim_group*condit*Pattern.Type +  (1|sbjCode), data=cat_sim)
# summary(m1)
```
```{r}
cat_sim_test |>
  mutate(Quartile = as.factor(ntile(resp, 4))) |> group_by(condit) |> summarise(mean_rating=mean(resp),mean_acc=mean(Corr))
cat_sim_test |>
  mutate(Quartile = as.factor(ntile(resp, 4))) |> group_by(condit,Pattern.Type) |> summarise(mean_rating=mean(resp),mean_acc=mean(Corr))
```


